
 Yahoo Finance
 Investors Will Want Tiong Woon Corporation Holding's (SGX:BQM) Growth In ROCE To Persist
What are the early trends we should look for to identify a stock that could multiply in value over the long term? In a perfect world, we'd like to see a company investing more capital into its business and ideally the returns earned from that capital are also increasing. This shows us that it's a compounding machine, able to continually reinvest its earnings back into the business and generate higher returns. Speaking of which, we noticed some great changes in Tiong Woon Corporation Holding's (SGX:BQM) returns on capital, so let's have a look.
Return On Capital Employed (ROCE): What Is It?
Just to clarify if you're unsure, ROCE is a metric for evaluating how much pre-tax income (in percentage terms) a company earns on the capital invested in its business. Analysts use this formula to calculate it for Tiong Woon Corporation Holding:
Return on Capital Employed = Earnings Before Interest and Tax (EBIT) ÷ (Total Assets - Current Liabilities)
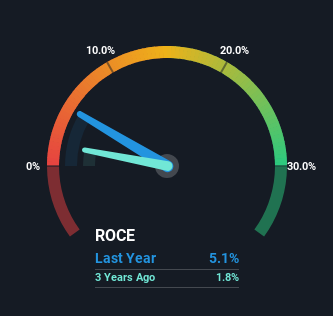
0.051 = S$23m ÷ (S$523m - S$83m) (Based on the trailing twelve months to December 2023).
Thus, Tiong Woon Corporation Holding has an ROCE of 5.1%. Ultimately, that's a low return and it under-performs the Commercial Services industry average of 7.8%.
See our latest analysis for Tiong Woon Corporation Holding
Above you can see how the current ROCE for Tiong Woon Corporation Holding compares to its prior returns on capital, but there's only so much you can tell from the past. If you're interested, you can view the analysts predictions in our free analyst report for Tiong Woon Corporation Holding .
The Trend Of ROCE
We're glad to see that ROCE is heading in the right direction, even if it is still low at the moment. The data shows that returns on capital have increased substantially over the last five years to 5.1%. The company is effectively making more money per dollar of capital used, and it's worth noting that the amount of capital has increased too, by 21%. The increasing returns on a growing amount of capital is common amongst multi-baggers and that's why we're impressed.
What We Can Learn From Tiong Woon Corporation Holding's ROCE
In summary, it's great to see that Tiong Woon Corporation Holding can compound returns by consistently reinvesting capital at increasing rates of return, because these are some of the key ingredients of those highly sought after multi-baggers. Since the stock has returned a solid 80% to shareholders over the last five years, it's fair to say investors are beginning to recognize these changes. Therefore, we think it would be worth your time to check if these trends are going to continue.
On a separate note, we've found 2 warning signs for Tiong Woon Corporation Holding you'll probably want to know about.
While Tiong Woon Corporation Holding may not currently earn the highest returns, we've compiled a list of companies that currently earn more than 25% return on equity. Check out this free list here.
Have feedback on this article? Concerned about the content? Get in touch with us directly. Alternatively, email editorial-team (at) simplywallst.com.
This article by Simply Wall St is general in nature. We provide commentary based on historical data and analyst forecasts only using an unbiased methodology and our articles are not intended to be financial advice. It does not constitute a recommendation to buy or sell any stock, and does not take account of your objectives, or your financial situation. We aim to bring you long-term focused analysis driven by fundamental data. Note that our analysis may not factor in the latest price-sensitive company announcements or qualitative material. Simply Wall St has no position in any stocks mentioned.
