
 Yahoo Finance
 Investors Will Want M/I Homes' (NYSE:MHO) Growth In ROCE To Persist
If you're looking for a multi-bagger, there's a few things to keep an eye out for. Firstly, we'd want to identify a growing return on capital employed (ROCE) and then alongside that, an ever-increasing base of capital employed. Ultimately, this demonstrates that it's a business that is reinvesting profits at increasing rates of return. So when we looked at M/I Homes (NYSE:MHO) and its trend of ROCE, we really liked what we saw.
Understanding Return On Capital Employed (ROCE)
For those that aren't sure what ROCE is, it measures the amount of pre-tax profits a company can generate from the capital employed in its business. Analysts use this formula to calculate it for M/I Homes:
Return on Capital Employed = Earnings Before Interest and Tax (EBIT) ÷ (Total Assets - Current Liabilities)
0.16 = US$577m ÷ (US$4.0b - US$509m) (Based on the trailing twelve months to December 2023).
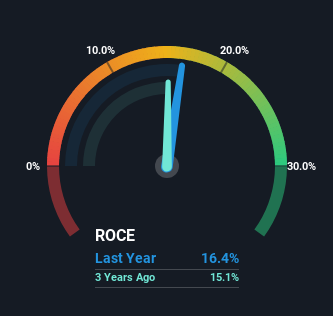
So, M/I Homes has an ROCE of 16%. That's a relatively normal return on capital, and it's around the 14% generated by the Consumer Durables industry.
Check out our latest analysis for M/I Homes
Above you can see how the current ROCE for M/I Homes compares to its prior returns on capital, but there's only so much you can tell from the past. If you'd like, you can check out the forecasts from the analysts covering M/I Homes for free.
The Trend Of ROCE
The trends we've noticed at M/I Homes are quite reassuring. Over the last five years, returns on capital employed have risen substantially to 16%. The company is effectively making more money per dollar of capital used, and it's worth noting that the amount of capital has increased too, by 112%. The increasing returns on a growing amount of capital is common amongst multi-baggers and that's why we're impressed.
What We Can Learn From M/I Homes' ROCE
In summary, it's great to see that M/I Homes can compound returns by consistently reinvesting capital at increasing rates of return, because these are some of the key ingredients of those highly sought after multi-baggers. And a remarkable 314% total return over the last five years tells us that investors are expecting more good things to come in the future. In light of that, we think it's worth looking further into this stock because if M/I Homes can keep these trends up, it could have a bright future ahead.
One more thing, we've spotted 1 warning sign facing M/I Homes that you might find interesting.
For those who like to invest in solid companies, check out this free list of companies with solid balance sheets and high returns on equity.
Have feedback on this article? Concerned about the content? Get in touch with us directly. Alternatively, email editorial-team (at) simplywallst.com.
This article by Simply Wall St is general in nature. We provide commentary based on historical data and analyst forecasts only using an unbiased methodology and our articles are not intended to be financial advice. It does not constitute a recommendation to buy or sell any stock, and does not take account of your objectives, or your financial situation. We aim to bring you long-term focused analysis driven by fundamental data. Note that our analysis may not factor in the latest price-sensitive company announcements or qualitative material. Simply Wall St has no position in any stocks mentioned.
