
 Yahoo Finance
 Investors Will Want KWS SAAT SE KGaA's (ETR:KWS) Growth In ROCE To Persist
If you're looking for a multi-bagger, there's a few things to keep an eye out for. Amongst other things, we'll want to see two things; firstly, a growing return on capital employed (ROCE) and secondly, an expansion in the company's amount of capital employed. Put simply, these types of businesses are compounding machines, meaning they are continually reinvesting their earnings at ever-higher rates of return. Speaking of which, we noticed some great changes in KWS SAAT SE KGaA's (ETR:KWS) returns on capital, so let's have a look.
What Is Return On Capital Employed (ROCE)?
If you haven't worked with ROCE before, it measures the 'return' (pre-tax profit) a company generates from capital employed in its business. To calculate this metric for KWS SAAT SE KGaA, this is the formula:
Return on Capital Employed = Earnings Before Interest and Tax (EBIT) ÷ (Total Assets - Current Liabilities)
0.13 = €226m ÷ (€2.9b - €1.2b) (Based on the trailing twelve months to December 2023).
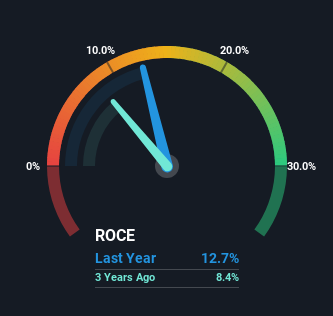
Therefore, KWS SAAT SE KGaA has an ROCE of 13%. On its own, that's a standard return, however it's much better than the 10% generated by the Food industry.
See our latest analysis for KWS SAAT SE KGaA
In the above chart we have measured KWS SAAT SE KGaA's prior ROCE against its prior performance, but the future is arguably more important. If you're interested, you can view the analysts predictions in our free analyst report for KWS SAAT SE KGaA .
What Does the ROCE Trend For KWS SAAT SE KGaA Tell Us?
Investors would be pleased with what's happening at KWS SAAT SE KGaA. Over the last five years, returns on capital employed have risen substantially to 13%. The company is effectively making more money per dollar of capital used, and it's worth noting that the amount of capital has increased too, by 58%. The increasing returns on a growing amount of capital is common amongst multi-baggers and that's why we're impressed.
For the record though, there was a noticeable increase in the company's current liabilities over the period, so we would attribute some of the ROCE growth to that. Essentially the business now has suppliers or short-term creditors funding about 40% of its operations, which isn't ideal. It's worth keeping an eye on this because as the percentage of current liabilities to total assets increases, some aspects of risk also increase.
In Conclusion...
To sum it up, KWS SAAT SE KGaA has proven it can reinvest in the business and generate higher returns on that capital employed, which is terrific. Given the stock has declined 17% in the last five years, this could be a good investment if the valuation and other metrics are also appealing. So researching this company further and determining whether or not these trends will continue seems justified.
One more thing: We've identified 2 warning signs with KWS SAAT SE KGaA (at least 1 which is a bit unpleasant) , and understanding them would certainly be useful.
If you want to search for solid companies with great earnings, check out this free list of companies with good balance sheets and impressive returns on equity.
Have feedback on this article? Concerned about the content? Get in touch with us directly. Alternatively, email editorial-team (at) simplywallst.com.
This article by Simply Wall St is general in nature. We provide commentary based on historical data and analyst forecasts only using an unbiased methodology and our articles are not intended to be financial advice. It does not constitute a recommendation to buy or sell any stock, and does not take account of your objectives, or your financial situation. We aim to bring you long-term focused analysis driven by fundamental data. Note that our analysis may not factor in the latest price-sensitive company announcements or qualitative material. Simply Wall St has no position in any stocks mentioned.
