
 Yahoo Finance
 Investors in Vera Bradley (NASDAQ:VRA) have unfortunately lost 45% over the last five years
For many, the main point of investing is to generate higher returns than the overall market. But even the best stock picker will only win with some selections. At this point some shareholders may be questioning their investment in Vera Bradley, Inc. (NASDAQ:VRA), since the last five years saw the share price fall 45%. Shareholders have had an even rougher run lately, with the share price down 10% in the last 90 days. We note that the company has reported results fairly recently; and the market is hardly delighted. You can check out the latest numbers in our company report.
It's worthwhile assessing if the company's economics have been moving in lockstep with these underwhelming shareholder returns, or if there is some disparity between the two. So let's do just that.
View our latest analysis for Vera Bradley
To paraphrase Benjamin Graham: Over the short term the market is a voting machine, but over the long term it's a weighing machine. One way to examine how market sentiment has changed over time is to look at the interaction between a company's share price and its earnings per share (EPS).
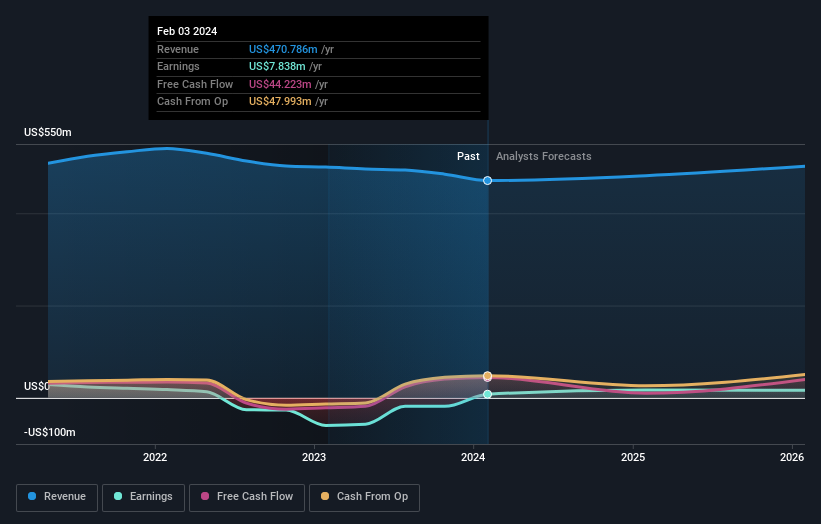
During five years of share price growth, Vera Bradley moved from a loss to profitability. Most would consider that to be a good thing, so it's counter-intuitive to see the share price declining. Other metrics may better explain the share price move.
In contrast to the share price, revenue has actually increased by 2.7% a year in the five year period. A more detailed examination of the revenue and earnings may or may not explain why the share price languishes; there could be an opportunity.
You can see below how earnings and revenue have changed over time (discover the exact values by clicking on the image).
We know that Vera Bradley has improved its bottom line lately, but what does the future have in store? So it makes a lot of sense to check out what analysts think Vera Bradley will earn in the future (free profit forecasts).
A Different Perspective
Vera Bradley shareholders gained a total return of 5.3% during the year. But that return falls short of the market. On the bright side, that's still a gain, and it is certainly better than the yearly loss of about 8% endured over half a decade. So this might be a sign the business has turned its fortunes around. I find it very interesting to look at share price over the long term as a proxy for business performance. But to truly gain insight, we need to consider other information, too. For example, we've discovered 1 warning sign for Vera Bradley that you should be aware of before investing here.
Of course Vera Bradley may not be the best stock to buy. So you may wish to see this free collection of growth stocks.
Please note, the market returns quoted in this article reflect the market weighted average returns of stocks that currently trade on American exchanges.
Have feedback on this article? Concerned about the content? Get in touch with us directly. Alternatively, email editorial-team (at) simplywallst.com.
This article by Simply Wall St is general in nature. We provide commentary based on historical data and analyst forecasts only using an unbiased methodology and our articles are not intended to be financial advice. It does not constitute a recommendation to buy or sell any stock, and does not take account of your objectives, or your financial situation. We aim to bring you long-term focused analysis driven by fundamental data. Note that our analysis may not factor in the latest price-sensitive company announcements or qualitative material. Simply Wall St has no position in any stocks mentioned.
