
 Yahoo Finance
 Investors in Thermo Fisher Scientific (NYSE:TMO) have seen respectable returns of 99% over the past five years
Stock pickers are generally looking for stocks that will outperform the broader market. And the truth is, you can make significant gains if you buy good quality businesses at the right price. To wit, the Thermo Fisher Scientific share price has climbed 97% in five years, easily topping the market return of 77% (ignoring dividends). On the other hand, the more recent gains haven't been so impressive, with shareholders gaining just 11%, including dividends.
Let's take a look at the underlying fundamentals over the longer term, and see if they've been consistent with shareholders returns.
View our latest analysis for Thermo Fisher Scientific
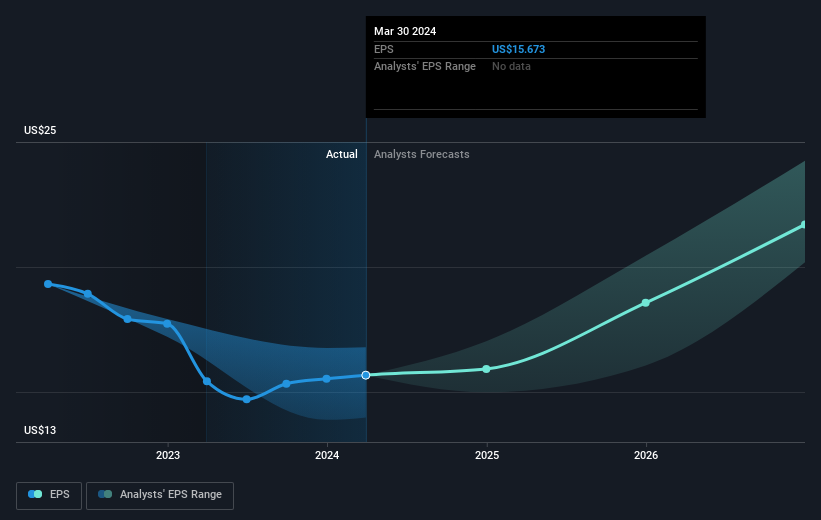
While the efficient markets hypothesis continues to be taught by some, it has been proven that markets are over-reactive dynamic systems, and investors are not always rational. One flawed but reasonable way to assess how sentiment around a company has changed is to compare the earnings per share (EPS) with the share price.
Over half a decade, Thermo Fisher Scientific managed to grow its earnings per share at 15% a year. That makes the EPS growth particularly close to the yearly share price growth of 14%. That suggests that the market sentiment around the company hasn't changed much over that time. In fact, the share price seems to largely reflect the EPS growth.
You can see below how EPS has changed over time (discover the exact values by clicking on the image).
This free interactive report on Thermo Fisher Scientific's earnings, revenue and cash flow is a great place to start, if you want to investigate the stock further.
What About Dividends?
As well as measuring the share price return, investors should also consider the total shareholder return (TSR). Whereas the share price return only reflects the change in the share price, the TSR includes the value of dividends (assuming they were reinvested) and the benefit of any discounted capital raising or spin-off. Arguably, the TSR gives a more comprehensive picture of the return generated by a stock. As it happens, Thermo Fisher Scientific's TSR for the last 5 years was 99%, which exceeds the share price return mentioned earlier. This is largely a result of its dividend payments!
A Different Perspective
Thermo Fisher Scientific shareholders are up 11% for the year (even including dividends). But that return falls short of the market. If we look back over five years, the returns are even better, coming in at 15% per year for five years. It's quite possible the business continues to execute with prowess, even as the share price gains are slowing. It's always interesting to track share price performance over the longer term. But to understand Thermo Fisher Scientific better, we need to consider many other factors. Case in point: We've spotted 1 warning sign for Thermo Fisher Scientific you should be aware of.
If you would prefer to check out another company -- one with potentially superior financials -- then do not miss this free list of companies that have proven they can grow earnings.
Please note, the market returns quoted in this article reflect the market weighted average returns of stocks that currently trade on American exchanges.
Have feedback on this article? Concerned about the content? Get in touch with us directly. Alternatively, email editorial-team (at) simplywallst.com.
This article by Simply Wall St is general in nature. We provide commentary based on historical data and analyst forecasts only using an unbiased methodology and our articles are not intended to be financial advice. It does not constitute a recommendation to buy or sell any stock, and does not take account of your objectives, or your financial situation. We aim to bring you long-term focused analysis driven by fundamental data. Note that our analysis may not factor in the latest price-sensitive company announcements or qualitative material. Simply Wall St has no position in any stocks mentioned.
