
 Yahoo Finance
 Investors in Sinclair (NASDAQ:SBGI) from five years ago are still down 73%, even after 9.1% gain this past week
We're definitely into long term investing, but some companies are simply bad investments over any time frame. We really hate to see fellow investors lose their hard-earned money. Imagine if you held Sinclair, Inc. (NASDAQ:SBGI) for half a decade as the share price tanked 78%. Furthermore, it's down 15% in about a quarter. That's not much fun for holders.
On a more encouraging note the company has added US$103m to its market cap in just the last 7 days, so let's see if we can determine what's driven the five-year loss for shareholders.
See our latest analysis for Sinclair
Sinclair isn't currently profitable, so most analysts would look to revenue growth to get an idea of how fast the underlying business is growing. When a company doesn't make profits, we'd generally hope to see good revenue growth. As you can imagine, fast revenue growth, when maintained, often leads to fast profit growth.
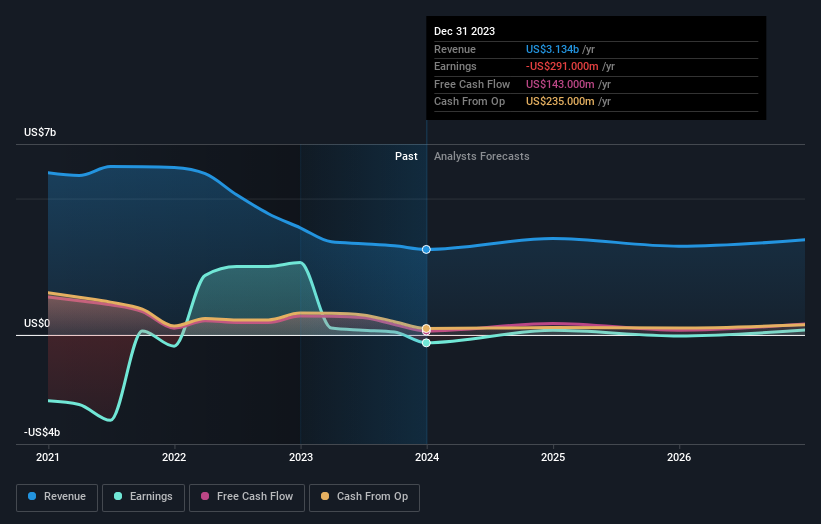
Over half a decade Sinclair reduced its trailing twelve month revenue by 0.4% for each year. That's not what investors generally want to see. If a business loses money, you want it to grow, so no surprises that the share price has dropped 12% each year in that time. It takes a certain kind of mental fortitude (or recklessness) to buy shares in a company that loses money and doesn't grow revenue. That is not really what the successful investors we know aim for.
The company's revenue and earnings (over time) are depicted in the image below (click to see the exact numbers).
We like that insiders have been buying shares in the last twelve months. Even so, future earnings will be far more important to whether current shareholders make money. This free report showing analyst forecasts should help you form a view on Sinclair
What About Dividends?
As well as measuring the share price return, investors should also consider the total shareholder return (TSR). The TSR is a return calculation that accounts for the value of cash dividends (assuming that any dividend received was reinvested) and the calculated value of any discounted capital raisings and spin-offs. So for companies that pay a generous dividend, the TSR is often a lot higher than the share price return. In the case of Sinclair, it has a TSR of -73% for the last 5 years. That exceeds its share price return that we previously mentioned. This is largely a result of its dividend payments!
A Different Perspective
Investors in Sinclair had a tough year, with a total loss of 8.5% (including dividends), against a market gain of about 26%. However, keep in mind that even the best stocks will sometimes underperform the market over a twelve month period. Unfortunately, longer term shareholders are suffering worse, given the loss of 12% doled out over the last five years. We would want clear information suggesting the company will grow, before taking the view that the share price will stabilize. It's always interesting to track share price performance over the longer term. But to understand Sinclair better, we need to consider many other factors. Even so, be aware that Sinclair is showing 3 warning signs in our investment analysis , and 1 of those is significant...
If you like to buy stocks alongside management, then you might just love this free list of companies. (Hint: insiders have been buying them).
Please note, the market returns quoted in this article reflect the market weighted average returns of stocks that currently trade on American exchanges.
Have feedback on this article? Concerned about the content? Get in touch with us directly. Alternatively, email editorial-team (at) simplywallst.com.
This article by Simply Wall St is general in nature. We provide commentary based on historical data and analyst forecasts only using an unbiased methodology and our articles are not intended to be financial advice. It does not constitute a recommendation to buy or sell any stock, and does not take account of your objectives, or your financial situation. We aim to bring you long-term focused analysis driven by fundamental data. Note that our analysis may not factor in the latest price-sensitive company announcements or qualitative material. Simply Wall St has no position in any stocks mentioned.
