
 Yahoo Finance
 Investors Shouldn't Overlook Marks Electrical Group's (LON:MRK) Impressive Returns On Capital
Finding a business that has the potential to grow substantially is not easy, but it is possible if we look at a few key financial metrics. In a perfect world, we'd like to see a company investing more capital into its business and ideally the returns earned from that capital are also increasing. Basically this means that a company has profitable initiatives that it can continue to reinvest in, which is a trait of a compounding machine. So when we looked at the ROCE trend of Marks Electrical Group (LON:MRK) we really liked what we saw.
What Is Return On Capital Employed (ROCE)?
For those that aren't sure what ROCE is, it measures the amount of pre-tax profits a company can generate from the capital employed in its business. To calculate this metric for Marks Electrical Group, this is the formula:
Return on Capital Employed = Earnings Before Interest and Tax (EBIT) ÷ (Total Assets - Current Liabilities)
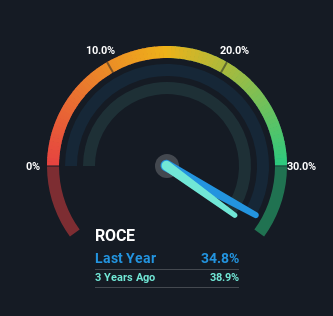
0.35 = UK£5.3m ÷ (UK£35m - UK£20m) (Based on the trailing twelve months to September 2023).
Therefore, Marks Electrical Group has an ROCE of 35%. That's a fantastic return and not only that, it outpaces the average of 14% earned by companies in a similar industry.
View our latest analysis for Marks Electrical Group
Above you can see how the current ROCE for Marks Electrical Group compares to its prior returns on capital, but there's only so much you can tell from the past. If you're interested, you can view the analysts predictions in our free analyst report for Marks Electrical Group .
The Trend Of ROCE
We like the trends that we're seeing from Marks Electrical Group. The numbers show that in the last four years, the returns generated on capital employed have grown considerably to 35%. The company is effectively making more money per dollar of capital used, and it's worth noting that the amount of capital has increased too, by 134%. The increasing returns on a growing amount of capital is common amongst multi-baggers and that's why we're impressed.
On a separate but related note, it's important to know that Marks Electrical Group has a current liabilities to total assets ratio of 57%, which we'd consider pretty high. This can bring about some risks because the company is basically operating with a rather large reliance on its suppliers or other sorts of short-term creditors. While it's not necessarily a bad thing, it can be beneficial if this ratio is lower.
What We Can Learn From Marks Electrical Group's ROCE
A company that is growing its returns on capital and can consistently reinvest in itself is a highly sought after trait, and that's what Marks Electrical Group has. Astute investors may have an opportunity here because the stock has declined 20% in the last year. With that in mind, we believe the promising trends warrant this stock for further investigation.
One more thing to note, we've identified 2 warning signs with Marks Electrical Group and understanding these should be part of your investment process.
Marks Electrical Group is not the only stock earning high returns. If you'd like to see more, check out our free list of companies earning high returns on equity with solid fundamentals.
Have feedback on this article? Concerned about the content? Get in touch with us directly. Alternatively, email editorial-team (at) simplywallst.com.
This article by Simply Wall St is general in nature. We provide commentary based on historical data and analyst forecasts only using an unbiased methodology and our articles are not intended to be financial advice. It does not constitute a recommendation to buy or sell any stock, and does not take account of your objectives, or your financial situation. We aim to bring you long-term focused analysis driven by fundamental data. Note that our analysis may not factor in the latest price-sensitive company announcements or qualitative material. Simply Wall St has no position in any stocks mentioned.
