
 Yahoo Finance
 Investors Shouldn't Overlook Dropbox's (NASDAQ:DBX) Impressive Returns On Capital
If we want to find a potential multi-bagger, often there are underlying trends that can provide clues. One common approach is to try and find a company with returns on capital employed (ROCE) that are increasing, in conjunction with a growing amount of capital employed. Ultimately, this demonstrates that it's a business that is reinvesting profits at increasing rates of return. And in light of that, the trends we're seeing at Dropbox's (NASDAQ:DBX) look very promising so lets take a look.
Return On Capital Employed (ROCE): What Is It?
For those who don't know, ROCE is a measure of a company's yearly pre-tax profit (its return), relative to the capital employed in the business. The formula for this calculation on Dropbox is:
Return on Capital Employed = Earnings Before Interest and Tax (EBIT) ÷ (Total Assets - Current Liabilities)
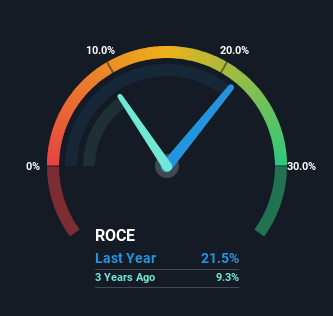
0.22 = US$384m ÷ (US$3.0b - US$1.2b) (Based on the trailing twelve months to December 2023).
Therefore, Dropbox has an ROCE of 22%. In absolute terms that's a great return and it's even better than the Software industry average of 7.3%.
Check out our latest analysis for Dropbox
In the above chart we have measured Dropbox's prior ROCE against its prior performance, but the future is arguably more important. If you'd like to see what analysts are forecasting going forward, you should check out our free analyst report for Dropbox .
What The Trend Of ROCE Can Tell Us
We're delighted to see that Dropbox is reaping rewards from its investments and is now generating some pre-tax profits. About five years ago the company was generating losses but things have turned around because it's now earning 22% on its capital. And unsurprisingly, like most companies trying to break into the black, Dropbox is utilizing 108% more capital than it was five years ago. This can indicate that there's plenty of opportunities to invest capital internally and at ever higher rates, both common traits of a multi-bagger.
Another thing to note, Dropbox has a high ratio of current liabilities to total assets of 40%. This can bring about some risks because the company is basically operating with a rather large reliance on its suppliers or other sorts of short-term creditors. Ideally we'd like to see this reduce as that would mean fewer obligations bearing risks.
What We Can Learn From Dropbox's ROCE
In summary, it's great to see that Dropbox has managed to break into profitability and is continuing to reinvest in its business. And given the stock has remained rather flat over the last five years, there might be an opportunity here if other metrics are strong. With that in mind, we believe the promising trends warrant this stock for further investigation.
On a final note, we found 3 warning signs for Dropbox (1 shouldn't be ignored) you should be aware of.
If you want to search for more stocks that have been earning high returns, check out this free list of stocks with solid balance sheets that are also earning high returns on equity.
Have feedback on this article? Concerned about the content? Get in touch with us directly. Alternatively, email editorial-team (at) simplywallst.com.
This article by Simply Wall St is general in nature. We provide commentary based on historical data and analyst forecasts only using an unbiased methodology and our articles are not intended to be financial advice. It does not constitute a recommendation to buy or sell any stock, and does not take account of your objectives, or your financial situation. We aim to bring you long-term focused analysis driven by fundamental data. Note that our analysis may not factor in the latest price-sensitive company announcements or qualitative material. Simply Wall St has no position in any stocks mentioned.
