
 Yahoo Finance
 Investors in Oceanus Group (SGX:579) have seen decent returns of 100% over the past five years
It hasn't been the best quarter for Oceanus Group Limited (SGX:579) shareholders, since the share price has fallen 11% in that time. But that doesn't change the fact that the returns over the last five years have been pleasing. It has returned a market beating 100% in that time. While the long term returns are impressive, we do have some sympathy for those who bought more recently, given the 33% drop, in the last year.
Now it's worth having a look at the company's fundamentals too, because that will help us determine if the long term shareholder return has matched the performance of the underlying business.
See our latest analysis for Oceanus Group
Given that Oceanus Group didn't make a profit in the last twelve months, we'll focus on revenue growth to form a quick view of its business development. Shareholders of unprofitable companies usually desire strong revenue growth. That's because it's hard to be confident a company will be sustainable if revenue growth is negligible, and it never makes a profit.
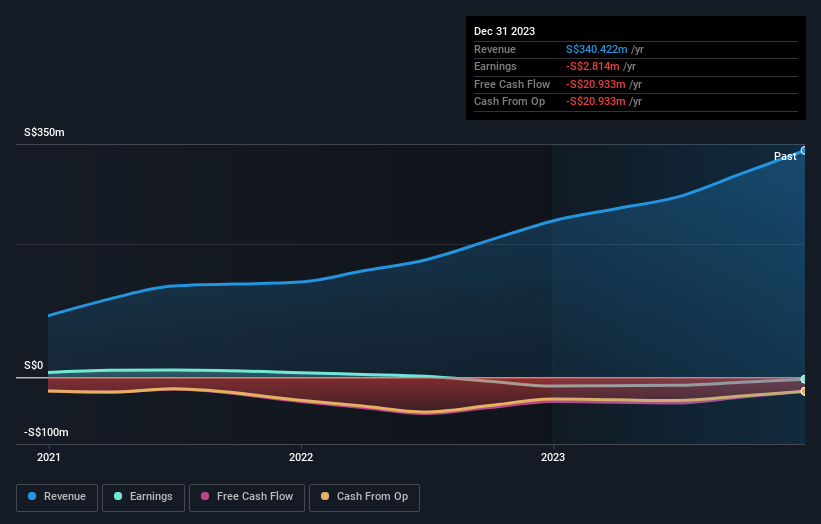
In the last 5 years Oceanus Group saw its revenue grow at 55% per year. That's well above most pre-profit companies. It's good to see that the stock has 15%, but not entirely surprising given revenue shows strong growth. If you think there could be more growth to come, now might be the time to take a close look at Oceanus Group. Of course, you'll have to research the business more fully to figure out if this is an attractive opportunity.
The company's revenue and earnings (over time) are depicted in the image below (click to see the exact numbers).
This free interactive report on Oceanus Group's balance sheet strength is a great place to start, if you want to investigate the stock further.
A Different Perspective
Oceanus Group shareholders are down 33% for the year, but the market itself is up 0.3%. Even the share prices of good stocks drop sometimes, but we want to see improvements in the fundamental metrics of a business, before getting too interested. On the bright side, long term shareholders have made money, with a gain of 15% per year over half a decade. It could be that the recent sell-off is an opportunity, so it may be worth checking the fundamental data for signs of a long term growth trend. It's always interesting to track share price performance over the longer term. But to understand Oceanus Group better, we need to consider many other factors. For example, we've discovered 3 warning signs for Oceanus Group that you should be aware of before investing here.
If you would prefer to check out another company -- one with potentially superior financials -- then do not miss this free list of companies that have proven they can grow earnings.
Please note, the market returns quoted in this article reflect the market weighted average returns of stocks that currently trade on Singaporean exchanges.
Have feedback on this article? Concerned about the content? Get in touch with us directly. Alternatively, email editorial-team (at) simplywallst.com.
This article by Simply Wall St is general in nature. We provide commentary based on historical data and analyst forecasts only using an unbiased methodology and our articles are not intended to be financial advice. It does not constitute a recommendation to buy or sell any stock, and does not take account of your objectives, or your financial situation. We aim to bring you long-term focused analysis driven by fundamental data. Note that our analysis may not factor in the latest price-sensitive company announcements or qualitative material. Simply Wall St has no position in any stocks mentioned.