
 Yahoo Finance
 Investors Met With Slowing Returns on Capital At Zeo Energy (NASDAQ:ZEO)
There are a few key trends to look for if we want to identify the next multi-bagger. Typically, we'll want to notice a trend of growing return on capital employed (ROCE) and alongside that, an expanding base of capital employed. Basically this means that a company has profitable initiatives that it can continue to reinvest in, which is a trait of a compounding machine. In light of that, when we looked at Zeo Energy (NASDAQ:ZEO) and its ROCE trend, we weren't exactly thrilled.
What Is Return On Capital Employed (ROCE)?
Just to clarify if you're unsure, ROCE is a metric for evaluating how much pre-tax income (in percentage terms) a company earns on the capital invested in its business. The formula for this calculation on Zeo Energy is:
Return on Capital Employed = Earnings Before Interest and Tax (EBIT) ÷ (Total Assets - Current Liabilities)
0.19 = US$6.5m ÷ (US$48m - US$14m) (Based on the trailing twelve months to December 2023).
Thus, Zeo Energy has an ROCE of 19%. On its own, that's a standard return, however it's much better than the 14% generated by the Electrical industry.
See our latest analysis for Zeo Energy
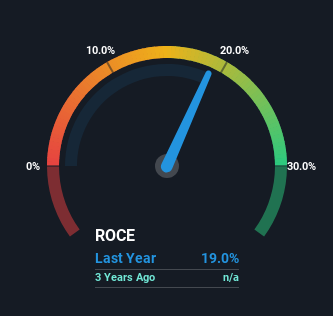
Historical performance is a great place to start when researching a stock so above you can see the gauge for Zeo Energy's ROCE against it's prior returns. If you want to delve into the historical earnings , check out these free graphs detailing revenue and cash flow performance of Zeo Energy.
What Does the ROCE Trend For Zeo Energy Tell Us?
There hasn't been much to report for Zeo Energy's returns and its level of capital employed because both metrics have been steady for the past two years. It's not uncommon to see this when looking at a mature and stable business that isn't re-investing its earnings because it has likely passed that phase of the business cycle. So don't be surprised if Zeo Energy doesn't end up being a multi-bagger in a few years time.
On another note, while the change in ROCE trend might not scream for attention, it's interesting that the current liabilities have actually gone up over the last two years. This is intriguing because if current liabilities hadn't increased to 28% of total assets, this reported ROCE would probably be less than19% because total capital employed would be higher.The 19% ROCE could be even lower if current liabilities weren't 28% of total assets, because the the formula would show a larger base of total capital employed. So while current liabilities isn't high right now, keep an eye out in case it increases further, because this can introduce some elements of risk.
The Bottom Line
In summary, Zeo Energy isn't compounding its earnings but is generating stable returns on the same amount of capital employed. Since the stock has declined 57% over the last year, investors may not be too optimistic on this trend improving either. Therefore based on the analysis done in this article, we don't think Zeo Energy has the makings of a multi-bagger.
Zeo Energy does have some risks, we noticed 2 warning signs (and 1 which shouldn't be ignored) we think you should know about.
If you want to search for solid companies with great earnings, check out this free list of companies with good balance sheets and impressive returns on equity.
Have feedback on this article? Concerned about the content? Get in touch with us directly. Alternatively, email editorial-team (at) simplywallst.com.
This article by Simply Wall St is general in nature. We provide commentary based on historical data and analyst forecasts only using an unbiased methodology and our articles are not intended to be financial advice. It does not constitute a recommendation to buy or sell any stock, and does not take account of your objectives, or your financial situation. We aim to bring you long-term focused analysis driven by fundamental data. Note that our analysis may not factor in the latest price-sensitive company announcements or qualitative material. Simply Wall St has no position in any stocks mentioned.
