
 Yahoo Finance
 Some Investors May Be Worried About BASF's (ETR:BAS) Returns On Capital
Ignoring the stock price of a company, what are the underlying trends that tell us a business is past the growth phase? When we see a declining return on capital employed (ROCE) in conjunction with a declining base of capital employed, that's often how a mature business shows signs of aging. Basically the company is earning less on its investments and it is also reducing its total assets. So after we looked into BASF (ETR:BAS), the trends above didn't look too great.
Understanding Return On Capital Employed (ROCE)
If you haven't worked with ROCE before, it measures the 'return' (pre-tax profit) a company generates from capital employed in its business. To calculate this metric for BASF, this is the formula:
Return on Capital Employed = Earnings Before Interest and Tax (EBIT) ÷ (Total Assets - Current Liabilities)
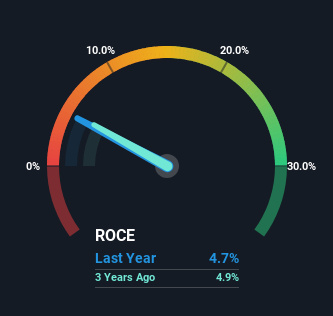
0.047 = €2.9b ÷ (€77b - €16b) (Based on the trailing twelve months to December 2023).
So, BASF has an ROCE of 4.7%. Ultimately, that's a low return and it under-performs the Chemicals industry average of 7.5%.
See our latest analysis for BASF
In the above chart we have measured BASF's prior ROCE against its prior performance, but the future is arguably more important. If you're interested, you can view the analysts predictions in our free analyst report for BASF .
So How Is BASF's ROCE Trending?
In terms of BASF's historical ROCE movements, the trend doesn't inspire confidence. About five years ago, returns on capital were 9.3%, however they're now substantially lower than that as we saw above. Meanwhile, capital employed in the business has stayed roughly the flat over the period. This combination can be indicative of a mature business that still has areas to deploy capital, but the returns received aren't as high due potentially to new competition or smaller margins. If these trends continue, we wouldn't expect BASF to turn into a multi-bagger.
Our Take On BASF's ROCE
All in all, the lower returns from the same amount of capital employed aren't exactly signs of a compounding machine. And, the stock has remained flat over the last five years, so investors don't seem too impressed either. With underlying trends that aren't great in these areas, we'd consider looking elsewhere.
One final note, you should learn about the 3 warning signs we've spotted with BASF (including 1 which is potentially serious) .
While BASF may not currently earn the highest returns, we've compiled a list of companies that currently earn more than 25% return on equity. Check out this free list here.
Have feedback on this article? Concerned about the content? Get in touch with us directly. Alternatively, email editorial-team (at) simplywallst.com.
This article by Simply Wall St is general in nature. We provide commentary based on historical data and analyst forecasts only using an unbiased methodology and our articles are not intended to be financial advice. It does not constitute a recommendation to buy or sell any stock, and does not take account of your objectives, or your financial situation. We aim to bring you long-term focused analysis driven by fundamental data. Note that our analysis may not factor in the latest price-sensitive company announcements or qualitative material. Simply Wall St has no position in any stocks mentioned.
