
 Yahoo Finance
 Investors in John B. Sanfilippo & Son (NASDAQ:JBSS) have seen respectable returns of 60% over the past five years
If you buy and hold a stock for many years, you'd hope to be making a profit. Furthermore, you'd generally like to see the share price rise faster than the market. But John B. Sanfilippo & Son, Inc. (NASDAQ:JBSS) has fallen short of that second goal, with a share price rise of 26% over five years, which is below the market return. Zooming in, the stock is actually down 15% in the last year.
So let's investigate and see if the longer term performance of the company has been in line with the underlying business' progress.
View our latest analysis for John B. Sanfilippo & Son
In his essay The Superinvestors of Graham-and-Doddsville Warren Buffett described how share prices do not always rationally reflect the value of a business. By comparing earnings per share (EPS) and share price changes over time, we can get a feel for how investor attitudes to a company have morphed over time.
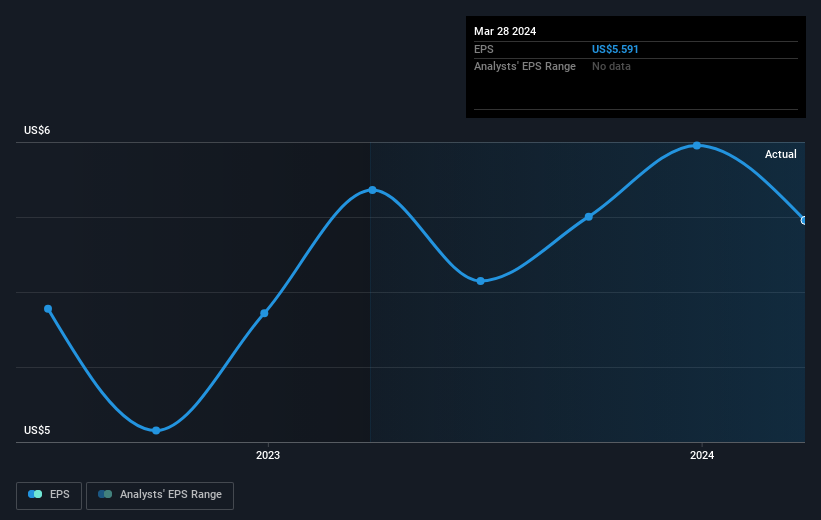
Over half a decade, John B. Sanfilippo & Son managed to grow its earnings per share at 14% a year. This EPS growth is higher than the 5% average annual increase in the share price. Therefore, it seems the market has become relatively pessimistic about the company.
The company's earnings per share (over time) is depicted in the image below (click to see the exact numbers).
It might be well worthwhile taking a look at our free report on John B. Sanfilippo & Son's earnings, revenue and cash flow.
What About Dividends?
As well as measuring the share price return, investors should also consider the total shareholder return (TSR). Whereas the share price return only reflects the change in the share price, the TSR includes the value of dividends (assuming they were reinvested) and the benefit of any discounted capital raising or spin-off. Arguably, the TSR gives a more comprehensive picture of the return generated by a stock. We note that for John B. Sanfilippo & Son the TSR over the last 5 years was 60%, which is better than the share price return mentioned above. The dividends paid by the company have thusly boosted the total shareholder return.
A Different Perspective
Investors in John B. Sanfilippo & Son had a tough year, with a total loss of 12% (including dividends), against a market gain of about 24%. Even the share prices of good stocks drop sometimes, but we want to see improvements in the fundamental metrics of a business, before getting too interested. Longer term investors wouldn't be so upset, since they would have made 10%, each year, over five years. It could be that the recent sell-off is an opportunity, so it may be worth checking the fundamental data for signs of a long term growth trend. While it is well worth considering the different impacts that market conditions can have on the share price, there are other factors that are even more important. To that end, you should be aware of the 1 warning sign we've spotted with John B. Sanfilippo & Son .
We will like John B. Sanfilippo & Son better if we see some big insider buys. While we wait, check out this free list of undervalued stocks (mostly small caps) with considerable, recent, insider buying.
Please note, the market returns quoted in this article reflect the market weighted average returns of stocks that currently trade on American exchanges.
Have feedback on this article? Concerned about the content? Get in touch with us directly. Alternatively, email editorial-team (at) simplywallst.com.
This article by Simply Wall St is general in nature. We provide commentary based on historical data and analyst forecasts only using an unbiased methodology and our articles are not intended to be financial advice. It does not constitute a recommendation to buy or sell any stock, and does not take account of your objectives, or your financial situation. We aim to bring you long-term focused analysis driven by fundamental data. Note that our analysis may not factor in the latest price-sensitive company announcements or qualitative material. Simply Wall St has no position in any stocks mentioned.
