
 Yahoo Finance
 Investors in Hai Leck Holdings (SGX:BLH) have unfortunately lost 1.8% over the last three years
While not a mind-blowing move, it is good to see that the Hai Leck Holdings Limited (SGX:BLH) share price has gained 10% in the last three months. But that doesn't change the fact that the returns over the last three years have been less than pleasing. In fact, the share price is down 28% in the last three years, falling well short of the market return.
With that in mind, it's worth seeing if the company's underlying fundamentals have been the driver of long term performance, or if there are some discrepancies.
View our latest analysis for Hai Leck Holdings
There is no denying that markets are sometimes efficient, but prices do not always reflect underlying business performance. By comparing earnings per share (EPS) and share price changes over time, we can get a feel for how investor attitudes to a company have morphed over time.
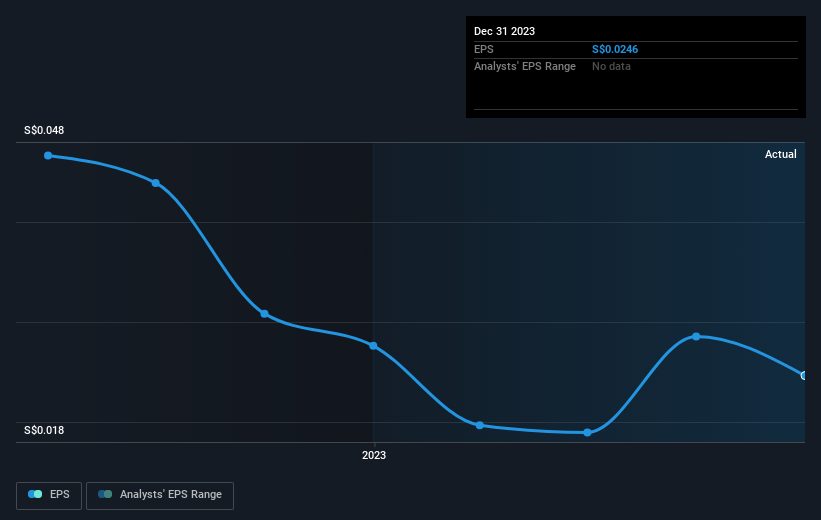
Hai Leck Holdings saw its EPS decline at a compound rate of 18% per year, over the last three years. In comparison the 10% compound annual share price decline isn't as bad as the EPS drop-off. So, despite the prior disappointment, shareholders must have some confidence the situation will improve, longer term.
The company's earnings per share (over time) is depicted in the image below (click to see the exact numbers).
We like that insiders have been buying shares in the last twelve months. Having said that, most people consider earnings and revenue growth trends to be a more meaningful guide to the business. This free interactive report on Hai Leck Holdings' earnings, revenue and cash flow is a great place to start, if you want to investigate the stock further.
What About Dividends?
When looking at investment returns, it is important to consider the difference between total shareholder return (TSR) and share price return. The TSR incorporates the value of any spin-offs or discounted capital raisings, along with any dividends, based on the assumption that the dividends are reinvested. Arguably, the TSR gives a more comprehensive picture of the return generated by a stock. We note that for Hai Leck Holdings the TSR over the last 3 years was -1.8%, which is better than the share price return mentioned above. This is largely a result of its dividend payments!
A Different Perspective
It's good to see that Hai Leck Holdings has rewarded shareholders with a total shareholder return of 9.7% in the last twelve months. Of course, that includes the dividend. That's better than the annualised return of 2% over half a decade, implying that the company is doing better recently. In the best case scenario, this may hint at some real business momentum, implying that now could be a great time to delve deeper. It's always interesting to track share price performance over the longer term. But to understand Hai Leck Holdings better, we need to consider many other factors. Take risks, for example - Hai Leck Holdings has 3 warning signs (and 1 which shouldn't be ignored) we think you should know about.
Hai Leck Holdings is not the only stock insiders are buying. So take a peek at this free list of growing companies with insider buying.
Please note, the market returns quoted in this article reflect the market weighted average returns of stocks that currently trade on Singaporean exchanges.
Have feedback on this article? Concerned about the content? Get in touch with us directly. Alternatively, email editorial-team (at) simplywallst.com.
This article by Simply Wall St is general in nature. We provide commentary based on historical data and analyst forecasts only using an unbiased methodology and our articles are not intended to be financial advice. It does not constitute a recommendation to buy or sell any stock, and does not take account of your objectives, or your financial situation. We aim to bring you long-term focused analysis driven by fundamental data. Note that our analysis may not factor in the latest price-sensitive company announcements or qualitative material. Simply Wall St has no position in any stocks mentioned.
