
 Yahoo Finance
 Investors in CTS (NYSE:CTS) have seen decent returns of 52% over the past five years
When you buy and hold a stock for the long term, you definitely want it to provide a positive return. Better yet, you'd like to see the share price move up more than the market average. Unfortunately for shareholders, while the CTS Corporation (NYSE:CTS) share price is up 49% in the last five years, that's less than the market return. The last year has been disappointing, with the stock price down 1.9% in that time.
So let's investigate and see if the longer term performance of the company has been in line with the underlying business' progress.
View our latest analysis for CTS
To paraphrase Benjamin Graham: Over the short term the market is a voting machine, but over the long term it's a weighing machine. By comparing earnings per share (EPS) and share price changes over time, we can get a feel for how investor attitudes to a company have morphed over time.
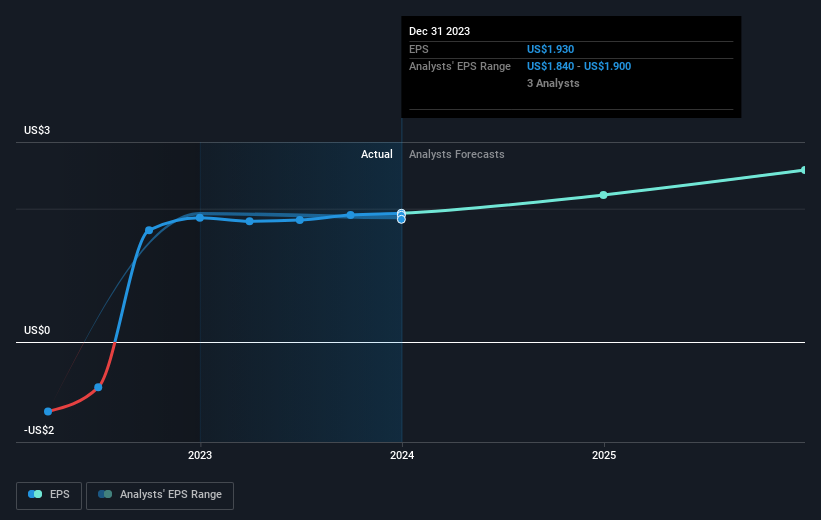
During five years of share price growth, CTS achieved compound earnings per share (EPS) growth of 6.9% per year. This EPS growth is reasonably close to the 8% average annual increase in the share price. Therefore one could conclude that sentiment towards the shares hasn't morphed very much. Indeed, it would appear the share price is reacting to the EPS.
You can see below how EPS has changed over time (discover the exact values by clicking on the image).
Before buying or selling a stock, we always recommend a close examination of historic growth trends, available here.
What About Dividends?
As well as measuring the share price return, investors should also consider the total shareholder return (TSR). Whereas the share price return only reflects the change in the share price, the TSR includes the value of dividends (assuming they were reinvested) and the benefit of any discounted capital raising or spin-off. Arguably, the TSR gives a more comprehensive picture of the return generated by a stock. In the case of CTS, it has a TSR of 52% for the last 5 years. That exceeds its share price return that we previously mentioned. The dividends paid by the company have thusly boosted the total shareholder return.
A Different Perspective
While the broader market gained around 28% in the last year, CTS shareholders lost 1.6% (even including dividends). However, keep in mind that even the best stocks will sometimes underperform the market over a twelve month period. Longer term investors wouldn't be so upset, since they would have made 9%, each year, over five years. If the fundamental data continues to indicate long term sustainable growth, the current sell-off could be an opportunity worth considering. Is CTS cheap compared to other companies? These 3 valuation measures might help you decide.
For those who like to find winning investments this free list of growing companies with recent insider purchasing, could be just the ticket.
Please note, the market returns quoted in this article reflect the market weighted average returns of stocks that currently trade on American exchanges.
Have feedback on this article? Concerned about the content? Get in touch with us directly. Alternatively, email editorial-team (at) simplywallst.com.
This article by Simply Wall St is general in nature. We provide commentary based on historical data and analyst forecasts only using an unbiased methodology and our articles are not intended to be financial advice. It does not constitute a recommendation to buy or sell any stock, and does not take account of your objectives, or your financial situation. We aim to bring you long-term focused analysis driven by fundamental data. Note that our analysis may not factor in the latest price-sensitive company announcements or qualitative material. Simply Wall St has no position in any stocks mentioned.
