
 Yahoo Finance
 Investors bid TrueContext (CVE:TCXT) up CA$9.4m despite increasing losses YoY, taking five-year CAGR to 15%
Stock pickers are generally looking for stocks that will outperform the broader market. Buying under-rated businesses is one path to excess returns. To wit, the TrueContext share price has climbed 100% in five years, easily topping the market return of 48% (ignoring dividends). On the other hand, the more recent gains haven't been so impressive, with shareholders gaining just 10%.
On the back of a solid 7-day performance, let's check what role the company's fundamentals have played in driving long term shareholder returns.
See our latest analysis for TrueContext
TrueContext wasn't profitable in the last twelve months, it is unlikely we'll see a strong correlation between its share price and its earnings per share (EPS). Arguably revenue is our next best option. When a company doesn't make profits, we'd generally expect to see good revenue growth. As you can imagine, fast revenue growth, when maintained, often leads to fast profit growth.
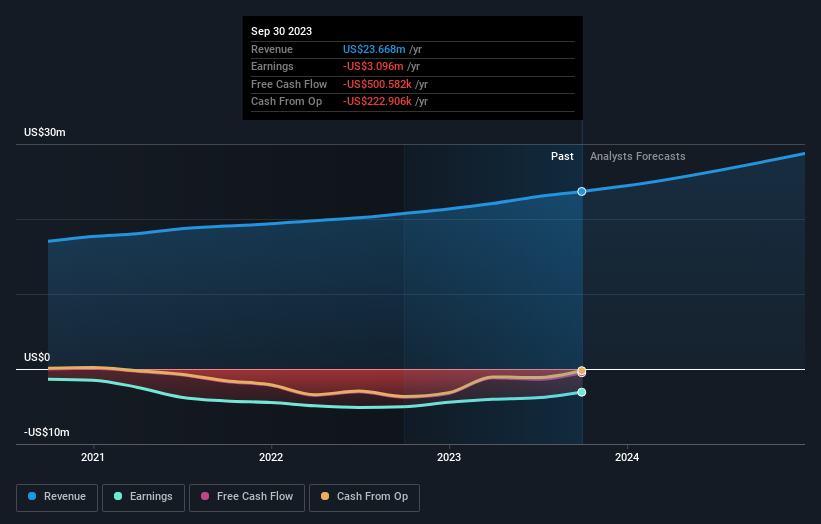
For the last half decade, TrueContext can boast revenue growth at a rate of 13% per year. That's a fairly respectable growth rate. Revenue has been growing at a reasonable clip, so it's debatable whether the share price growth of 15% full reflects the underlying business growth. The key question is whether revenue growth will slow down, and if so, how quickly. Lack of earnings means you have to project further into the future justify the valuation on the basis of future free cash flow.
The company's revenue and earnings (over time) are depicted in the image below (click to see the exact numbers).
You can see how its balance sheet has strengthened (or weakened) over time in this free interactive graphic.
A Different Perspective
It's good to see that TrueContext has rewarded shareholders with a total shareholder return of 10% in the last twelve months. Having said that, the five-year TSR of 15% a year, is even better. Potential buyers might understandably feel they've missed the opportunity, but it's always possible business is still firing on all cylinders. It's always interesting to track share price performance over the longer term. But to understand TrueContext better, we need to consider many other factors. Even so, be aware that TrueContext is showing 3 warning signs in our investment analysis , and 2 of those make us uncomfortable...
If you would prefer to check out another company -- one with potentially superior financials -- then do not miss this free list of companies that have proven they can grow earnings.
Please note, the market returns quoted in this article reflect the market weighted average returns of stocks that currently trade on Canadian exchanges.
Have feedback on this article? Concerned about the content? Get in touch with us directly. Alternatively, email editorial-team (at) simplywallst.com.
This article by Simply Wall St is general in nature. We provide commentary based on historical data and analyst forecasts only using an unbiased methodology and our articles are not intended to be financial advice. It does not constitute a recommendation to buy or sell any stock, and does not take account of your objectives, or your financial situation. We aim to bring you long-term focused analysis driven by fundamental data. Note that our analysis may not factor in the latest price-sensitive company announcements or qualitative material. Simply Wall St has no position in any stocks mentioned.
