
 Yahoo Finance
 Investing in Valuetronics Holdings (SGX:BN2) five years ago would have delivered you a 13% gain
It's possible to achieve returns close to the market-weighted average return by buying an index fund. But even in a market-beating portfolio, some stocks will lag the market. While the Valuetronics Holdings Limited (SGX:BN2) share price is down 16% over half a decade, the total return to shareholders (which includes dividends) was 13%. That's better than the market which declined 4.5% over the same time.
Since shareholders are down over the longer term, lets look at the underlying fundamentals over the that time and see if they've been consistent with returns.
Check out our latest analysis for Valuetronics Holdings
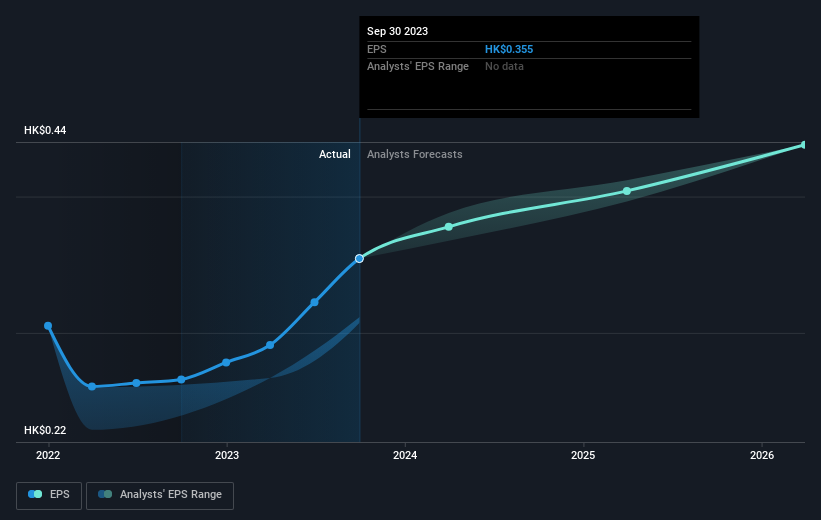
To quote Buffett, 'Ships will sail around the world but the Flat Earth Society will flourish. There will continue to be wide discrepancies between price and value in the marketplace...' One imperfect but simple way to consider how the market perception of a company has shifted is to compare the change in the earnings per share (EPS) with the share price movement.
During the five years over which the share price declined, Valuetronics Holdings' earnings per share (EPS) dropped by 5.0% each year. This fall in the EPS is worse than the 3% compound annual share price fall. So the market may previously have expected a drop, or else it expects the situation will improve.
The company's earnings per share (over time) is depicted in the image below (click to see the exact numbers).
We know that Valuetronics Holdings has improved its bottom line lately, but is it going to grow revenue? This free report showing analyst revenue forecasts should help you figure out if the EPS growth can be sustained.
What About Dividends?
It is important to consider the total shareholder return, as well as the share price return, for any given stock. The TSR incorporates the value of any spin-offs or discounted capital raisings, along with any dividends, based on the assumption that the dividends are reinvested. So for companies that pay a generous dividend, the TSR is often a lot higher than the share price return. We note that for Valuetronics Holdings the TSR over the last 5 years was 13%, which is better than the share price return mentioned above. And there's no prize for guessing that the dividend payments largely explain the divergence!
A Different Perspective
It's good to see that Valuetronics Holdings has rewarded shareholders with a total shareholder return of 23% in the last twelve months. And that does include the dividend. That gain is better than the annual TSR over five years, which is 3%. Therefore it seems like sentiment around the company has been positive lately. In the best case scenario, this may hint at some real business momentum, implying that now could be a great time to delve deeper. It's always interesting to track share price performance over the longer term. But to understand Valuetronics Holdings better, we need to consider many other factors. For instance, we've identified 1 warning sign for Valuetronics Holdings that you should be aware of.
Of course Valuetronics Holdings may not be the best stock to buy. So you may wish to see this free collection of growth stocks.
Please note, the market returns quoted in this article reflect the market weighted average returns of stocks that currently trade on Singaporean exchanges.
Have feedback on this article? Concerned about the content? Get in touch with us directly. Alternatively, email editorial-team (at) simplywallst.com.
This article by Simply Wall St is general in nature. We provide commentary based on historical data and analyst forecasts only using an unbiased methodology and our articles are not intended to be financial advice. It does not constitute a recommendation to buy or sell any stock, and does not take account of your objectives, or your financial situation. We aim to bring you long-term focused analysis driven by fundamental data. Note that our analysis may not factor in the latest price-sensitive company announcements or qualitative material. Simply Wall St has no position in any stocks mentioned.
