
 Yahoo Finance
 Investing in Trip.com Group (NASDAQ:TCOM) a year ago would have delivered you a 69% gain
If you want to compound wealth in the stock market, you can do so by buying an index fund. But if you pick the right individual stocks, you could make more than that. To wit, the Trip.com Group Limited (NASDAQ:TCOM) share price is 69% higher than it was a year ago, much better than the market return of around 28% (not including dividends) in the same period. If it can keep that out-performance up over the long term, investors will do very well! And shareholders have also done well over the long term, with an increase of 40% in the last three years.
Let's take a look at the underlying fundamentals over the longer term, and see if they've been consistent with shareholders returns.
View our latest analysis for Trip.com Group
In his essay The Superinvestors of Graham-and-Doddsville Warren Buffett described how share prices do not always rationally reflect the value of a business. By comparing earnings per share (EPS) and share price changes over time, we can get a feel for how investor attitudes to a company have morphed over time.
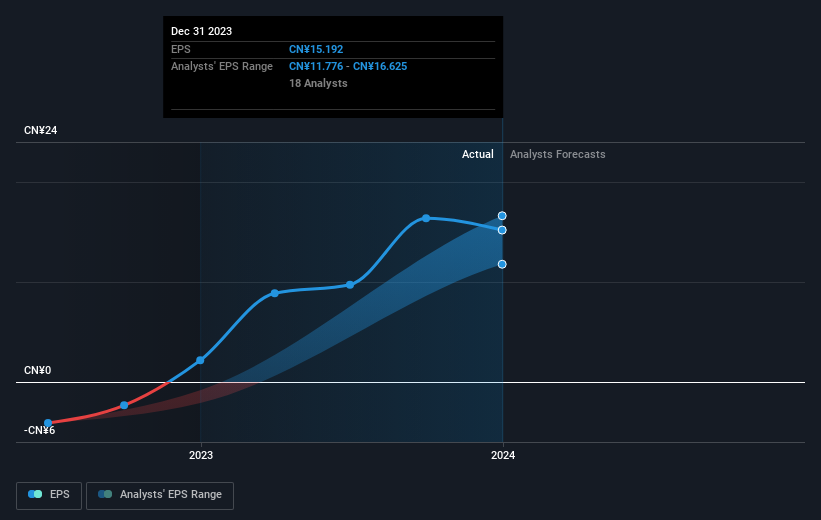
Trip.com Group boasted truly magnificent EPS growth in the last year. This remarkable growth rate may not be sustainable, but it is still impressive. So we'd expect to see the share price higher. We're real advocates of letting inflection points like this guide our research as stock pickers.
The image below shows how EPS has tracked over time (if you click on the image you can see greater detail).
It is of course excellent to see how Trip.com Group has grown profits over the years, but the future is more important for shareholders. This free interactive report on Trip.com Group's balance sheet strength is a great place to start, if you want to investigate the stock further.
A Different Perspective
It's good to see that Trip.com Group has rewarded shareholders with a total shareholder return of 69% in the last twelve months. That's better than the annualised return of 10% over half a decade, implying that the company is doing better recently. In the best case scenario, this may hint at some real business momentum, implying that now could be a great time to delve deeper. Before forming an opinion on Trip.com Group you might want to consider these 3 valuation metrics.
For those who like to find winning investments this free list of undervalued companies with recent insider purchasing, could be just the ticket.
Please note, the market returns quoted in this article reflect the market weighted average returns of stocks that currently trade on American exchanges.
Have feedback on this article? Concerned about the content? Get in touch with us directly. Alternatively, email editorial-team (at) simplywallst.com.
This article by Simply Wall St is general in nature. We provide commentary based on historical data and analyst forecasts only using an unbiased methodology and our articles are not intended to be financial advice. It does not constitute a recommendation to buy or sell any stock, and does not take account of your objectives, or your financial situation. We aim to bring you long-term focused analysis driven by fundamental data. Note that our analysis may not factor in the latest price-sensitive company announcements or qualitative material. Simply Wall St has no position in any stocks mentioned.
