
 Yahoo Finance
 Investing in Powermatic Data Systems (SGX:BCY) five years ago would have delivered you a 126% gain
Generally speaking the aim of active stock picking is to find companies that provide returns that are superior to the market average. Buying under-rated businesses is one path to excess returns. For example, long term Powermatic Data Systems Limited (SGX:BCY) shareholders have enjoyed a 74% share price rise over the last half decade, well in excess of the market decline of around 24% (not including dividends). However, more recent returns haven't been as impressive as that, with the stock returning just 18% in the last year , including dividends .
So let's investigate and see if the longer term performance of the company has been in line with the underlying business' progress.
View our latest analysis for Powermatic Data Systems
There is no denying that markets are sometimes efficient, but prices do not always reflect underlying business performance. One way to examine how market sentiment has changed over time is to look at the interaction between a company's share price and its earnings per share (EPS).
Over half a decade, Powermatic Data Systems managed to grow its earnings per share at 18% a year. This EPS growth is higher than the 12% average annual increase in the share price. So it seems the market isn't so enthusiastic about the stock these days. The reasonably low P/E ratio of 9.33 also suggests market apprehension.
You can see how EPS has changed over time in the image below (click on the chart to see the exact values).
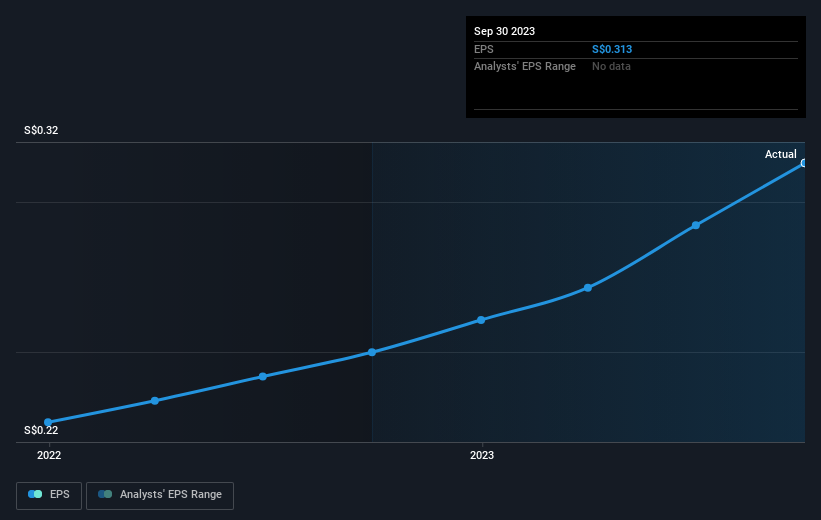
Dive deeper into Powermatic Data Systems' key metrics by checking this interactive graph of Powermatic Data Systems's earnings, revenue and cash flow.
What About Dividends?
As well as measuring the share price return, investors should also consider the total shareholder return (TSR). The TSR incorporates the value of any spin-offs or discounted capital raisings, along with any dividends, based on the assumption that the dividends are reinvested. Arguably, the TSR gives a more comprehensive picture of the return generated by a stock. As it happens, Powermatic Data Systems' TSR for the last 5 years was 126%, which exceeds the share price return mentioned earlier. The dividends paid by the company have thusly boosted the total shareholder return.
A Different Perspective
We're pleased to report that Powermatic Data Systems shareholders have received a total shareholder return of 18% over one year. Of course, that includes the dividend. However, that falls short of the 18% TSR per annum it has made for shareholders, each year, over five years. While it is well worth considering the different impacts that market conditions can have on the share price, there are other factors that are even more important. For instance, we've identified 2 warning signs for Powermatic Data Systems that you should be aware of.
If you are like me, then you will not want to miss this free list of growing companies that insiders are buying.
Please note, the market returns quoted in this article reflect the market weighted average returns of stocks that currently trade on Singaporean exchanges.
Have feedback on this article? Concerned about the content? Get in touch with us directly. Alternatively, email editorial-team (at) simplywallst.com.
This article by Simply Wall St is general in nature. We provide commentary based on historical data and analyst forecasts only using an unbiased methodology and our articles are not intended to be financial advice. It does not constitute a recommendation to buy or sell any stock, and does not take account of your objectives, or your financial situation. We aim to bring you long-term focused analysis driven by fundamental data. Note that our analysis may not factor in the latest price-sensitive company announcements or qualitative material. Simply Wall St has no position in any stocks mentioned.
