
 Yahoo Finance
 Investing in MindChamps PreSchool (SGX:CNE) a year ago would have delivered you a 65% gain
Passive investing in index funds can generate returns that roughly match the overall market. But if you pick the right individual stocks, you could make more than that. To wit, the MindChamps PreSchool Limited (SGX:CNE) share price is 65% higher than it was a year ago, much better than the market decline of around 8.3% (not including dividends) in the same period. So that should have shareholders smiling. In contrast, the longer term returns are negative, since the share price is 6.7% lower than it was three years ago.
Let's take a look at the underlying fundamentals over the longer term, and see if they've been consistent with shareholders returns.
Check out our latest analysis for MindChamps PreSchool
While the efficient markets hypothesis continues to be taught by some, it has been proven that markets are over-reactive dynamic systems, and investors are not always rational. One flawed but reasonable way to assess how sentiment around a company has changed is to compare the earnings per share (EPS) with the share price.
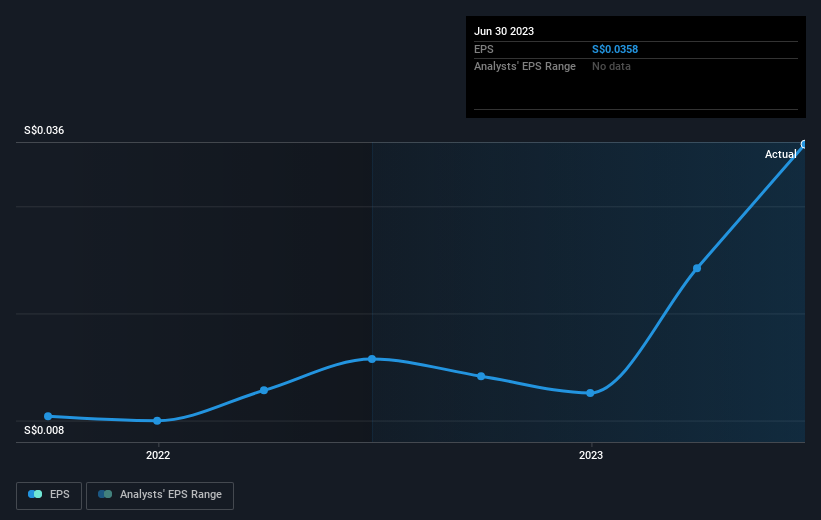
MindChamps PreSchool was able to grow EPS by 127% in the last twelve months. It's fair to say that the share price gain of 65% did not keep pace with the EPS growth. So it seems like the market has cooled on MindChamps PreSchool, despite the growth. Interesting. The caution is also evident in the lowish P/E ratio of 7.82.
The company's earnings per share (over time) is depicted in the image below (click to see the exact numbers).
Dive deeper into MindChamps PreSchool's key metrics by checking this interactive graph of MindChamps PreSchool's earnings, revenue and cash flow.
A Different Perspective
It's nice to see that MindChamps PreSchool shareholders have received a total shareholder return of 65% over the last year. Notably the five-year annualised TSR loss of 8% per year compares very unfavourably with the recent share price performance. This makes us a little wary, but the business might have turned around its fortunes. It's always interesting to track share price performance over the longer term. But to understand MindChamps PreSchool better, we need to consider many other factors. To that end, you should learn about the 4 warning signs we've spotted with MindChamps PreSchool (including 1 which is a bit unpleasant) .
If you would prefer to check out another company -- one with potentially superior financials -- then do not miss this free list of companies that have proven they can grow earnings.
Please note, the market returns quoted in this article reflect the market weighted average returns of stocks that currently trade on Singaporean exchanges.
Have feedback on this article? Concerned about the content? Get in touch with us directly. Alternatively, email editorial-team (at) simplywallst.com.
This article by Simply Wall St is general in nature. We provide commentary based on historical data and analyst forecasts only using an unbiased methodology and our articles are not intended to be financial advice. It does not constitute a recommendation to buy or sell any stock, and does not take account of your objectives, or your financial situation. We aim to bring you long-term focused analysis driven by fundamental data. Note that our analysis may not factor in the latest price-sensitive company announcements or qualitative material. Simply Wall St has no position in any stocks mentioned.
