
 Yahoo Finance
 Investing in Doric Nimrod Air Two (LON:DNA2) three years ago would have delivered you a 175% gain
By buying an index fund, investors can approximate the average market return. But if you choose individual stocks with prowess, you can make superior returns. Just take a look at Doric Nimrod Air Two Limited (LON:DNA2), which is up 48%, over three years, soundly beating the market return of 3.8% (not including dividends). On the other hand, the returns haven't been quite so good recently, with shareholders up just 31% , including dividends .
So let's assess the underlying fundamentals over the last 3 years and see if they've moved in lock-step with shareholder returns.
Check out our latest analysis for Doric Nimrod Air Two
While the efficient markets hypothesis continues to be taught by some, it has been proven that markets are over-reactive dynamic systems, and investors are not always rational. One flawed but reasonable way to assess how sentiment around a company has changed is to compare the earnings per share (EPS) with the share price.
Doric Nimrod Air Two became profitable within the last three years. That would generally be considered a positive, so we'd expect the share price to be up.
The company's earnings per share (over time) is depicted in the image below (click to see the exact numbers).
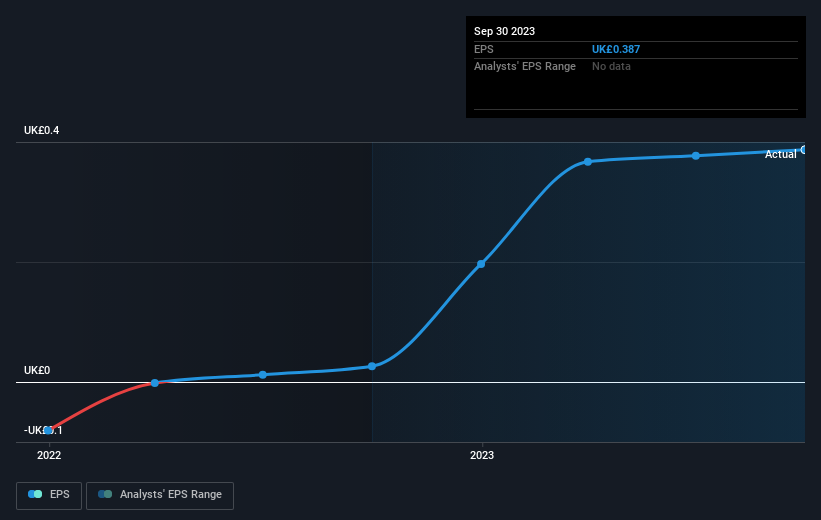
Dive deeper into Doric Nimrod Air Two's key metrics by checking this interactive graph of Doric Nimrod Air Two's earnings, revenue and cash flow.
What About Dividends?
As well as measuring the share price return, investors should also consider the total shareholder return (TSR). Whereas the share price return only reflects the change in the share price, the TSR includes the value of dividends (assuming they were reinvested) and the benefit of any discounted capital raising or spin-off. It's fair to say that the TSR gives a more complete picture for stocks that pay a dividend. As it happens, Doric Nimrod Air Two's TSR for the last 3 years was 175%, which exceeds the share price return mentioned earlier. This is largely a result of its dividend payments!
A Different Perspective
It's nice to see that Doric Nimrod Air Two shareholders have received a total shareholder return of 31% over the last year. And that does include the dividend. That's better than the annualised return of 10% over half a decade, implying that the company is doing better recently. Someone with an optimistic perspective could view the recent improvement in TSR as indicating that the business itself is getting better with time. Keeping this in mind, a solid next step might be to take a look at Doric Nimrod Air Two's dividend track record. This free interactive graph is a great place to start.
Of course, you might find a fantastic investment by looking elsewhere. So take a peek at this free list of companies we expect will grow earnings.
Please note, the market returns quoted in this article reflect the market weighted average returns of stocks that currently trade on British exchanges.
Have feedback on this article? Concerned about the content? Get in touch with us directly. Alternatively, email editorial-team (at) simplywallst.com.
This article by Simply Wall St is general in nature. We provide commentary based on historical data and analyst forecasts only using an unbiased methodology and our articles are not intended to be financial advice. It does not constitute a recommendation to buy or sell any stock, and does not take account of your objectives, or your financial situation. We aim to bring you long-term focused analysis driven by fundamental data. Note that our analysis may not factor in the latest price-sensitive company announcements or qualitative material. Simply Wall St has no position in any stocks mentioned.
