
 Yahoo Finance
 Investing in Baker Hughes (NASDAQ:BKR) three years ago would have delivered you a 75% gain
By buying an index fund, you can roughly match the market return with ease. But if you buy good businesses at attractive prices, your portfolio returns could exceed the average market return. For example, Baker Hughes Company (NASDAQ:BKR) shareholders have seen the share price rise 62% over three years, well in excess of the market return (7.0%, not including dividends). On the other hand, the returns haven't been quite so good recently, with shareholders up just 11% , including dividends .
So let's assess the underlying fundamentals over the last 3 years and see if they've moved in lock-step with shareholder returns.
View our latest analysis for Baker Hughes
To quote Buffett, 'Ships will sail around the world but the Flat Earth Society will flourish. There will continue to be wide discrepancies between price and value in the marketplace...' One imperfect but simple way to consider how the market perception of a company has shifted is to compare the change in the earnings per share (EPS) with the share price movement.
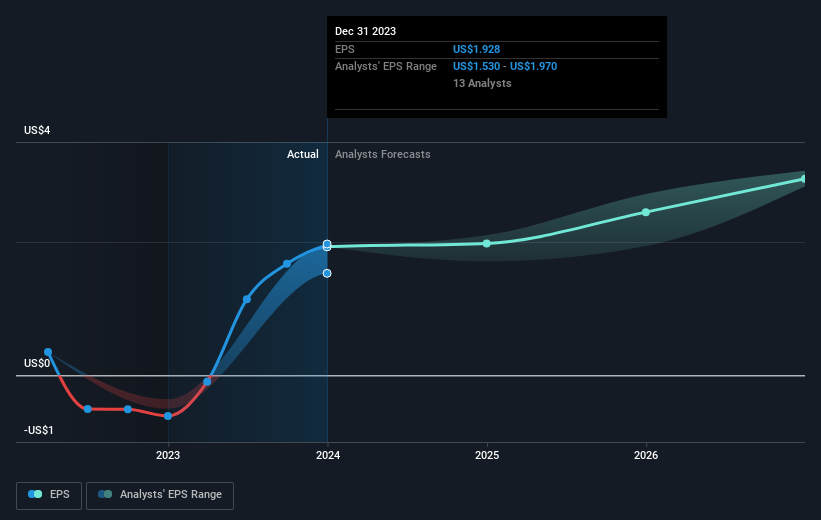
During three years of share price growth, Baker Hughes moved from a loss to profitability. So we would expect a higher share price over the period.
You can see below how EPS has changed over time (discover the exact values by clicking on the image).
It is of course excellent to see how Baker Hughes has grown profits over the years, but the future is more important for shareholders. If you are thinking of buying or selling Baker Hughes stock, you should check out this FREE detailed report on its balance sheet.
What About Dividends?
It is important to consider the total shareholder return, as well as the share price return, for any given stock. The TSR incorporates the value of any spin-offs or discounted capital raisings, along with any dividends, based on the assumption that the dividends are reinvested. So for companies that pay a generous dividend, the TSR is often a lot higher than the share price return. We note that for Baker Hughes the TSR over the last 3 years was 75%, which is better than the share price return mentioned above. This is largely a result of its dividend payments!
A Different Perspective
Baker Hughes provided a TSR of 11% over the last twelve months. But that was short of the market average. The silver lining is that the gain was actually better than the average annual return of 8% per year over five year. It is possible that returns will improve along with the business fundamentals. While it is well worth considering the different impacts that market conditions can have on the share price, there are other factors that are even more important. Case in point: We've spotted 1 warning sign for Baker Hughes you should be aware of.
Of course Baker Hughes may not be the best stock to buy. So you may wish to see this free collection of growth stocks.
Please note, the market returns quoted in this article reflect the market weighted average returns of stocks that currently trade on American exchanges.
Have feedback on this article? Concerned about the content? Get in touch with us directly. Alternatively, email editorial-team (at) simplywallst.com.
This article by Simply Wall St is general in nature. We provide commentary based on historical data and analyst forecasts only using an unbiased methodology and our articles are not intended to be financial advice. It does not constitute a recommendation to buy or sell any stock, and does not take account of your objectives, or your financial situation. We aim to bring you long-term focused analysis driven by fundamental data. Note that our analysis may not factor in the latest price-sensitive company announcements or qualitative material. Simply Wall St has no position in any stocks mentioned.
