
 Yahoo Finance
 Insperity (NSP) Stock Barely Moves Despite Q1 Earnings Beat

Insperity, Inc. NSP reported mixed first-quarter 2024 results, wherein earnings surpassed the Zacks Consensus Estimate, while revenues missed the same.
NSP’s shares have barely moved since its earnings release on May 1 despite an earnings beat.
Adjusted earnings (excluding 19 cents from non-recurring items) of $2.27 per share outpaced the consensus estimate by 7.6% but declined 15% year over year. Revenues of $1.8 billion missed the Zacks Consensus Estimate by a slight margin but increased 1.8% from the year-ago quarter.
The company’s stock has gained 9.3% over the past three months, outperforming the 4.5% rally of the industry it belongs to.
The average number of worksite employees paid per month decreased 1% year over year to 303,904. Revenue per worksite employees (WSEE) per month increased 3% from the year-ago quarter to $1,977.
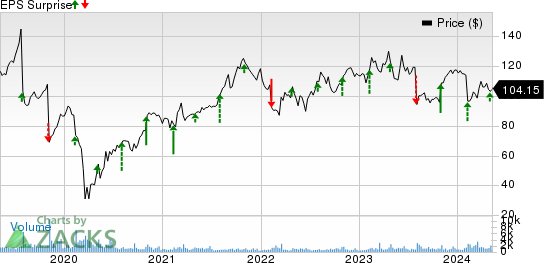
Insperity, Inc. Price and EPS Surprise
Insperity, Inc. price-eps-surprise | Insperity, Inc. Quote
Operating Results
Gross profit increased 4% year over year to $345 million. The Gross Profit margin was 19.1%, up 35 basis points from the first quarter of 2023. Operating expenses increased 12% from the year-ago quarter to $237 million. Operating expenses per WSEE per month increased 14% on a year-over-year basis to $260 million.
Operating income decreased 11% year over year to $108 million. Operating income per WSEE per month declined 56.4% year over year to $24. The operating margin was 6% in the reported quarter, down 80 basis points from the year-ago quarter.
Adjusted EBITDA for the reported quarter is $142 million, down 9% from the year-ago reported figure.
Balance Sheet & Cash Flow
Insperity exited first-quarter 2024 with cash and cash equivalents amounting to $667 million compared with the $693 million reported in the preceding quarter. The long-term debt amounted to $369 million, flat sequentially.
In the reported quarter, NSP distributed $21 million as cash dividends. Capital expenditure totaled $5 million.
Q2 and 2024 Guidance
For the second quarter, NSP expects adjusted earnings per share of 61-83 cents. The mid-point (72 cents) of the guided range is higher than the Zacks Consensus Estimate of 71 cents. Adjusted EBITDA is anticipated to be $53-$66 million.
For 2024, adjusted earnings per share are expected between $3.17 and $3.90. The mid-point ($3.54) of the guided range is the same as the Zacks Consensus Estimate. Adjusted EBITDA is anticipated to be $254-$293 million.
Currently, Insperity carries a Zacks Rank #3 (Hold). You can see the complete list of today’s Zacks #1 Rank (Strong Buy) stocks here.
Earnings Snapshot of Some Business Services Stocks
Broadridge Financial Solutions, Inc.’s BR third-quarter fiscal 2024 earnings met the Zacks Consensus Estimate, while revenues missed the same.
BR’s adjusted earnings (adjusting 44 cents from non-recurring items) of $2.23 per share increased 8.8% from the year-ago quarter. Total revenues of $1.7 billion missed the consensus mark by 1.8% and were up 4.9% year over year.
Omnicom Group Inc. OMC reported impressive first-quarter 2024 results.
OMC's earnings of $1.67 per share beat the consensus estimate by 9.9% and increased 7.1% year over year. Total revenues of $3.6 billion surpassed the consensus estimate by 1.6% and increased 5.4% year over year.
Want the latest recommendations from Zacks Investment Research? Today, you can download 7 Best Stocks for the Next 30 Days. Click to get this free report
Broadridge Financial Solutions, Inc. (BR) : Free Stock Analysis Report
Omnicom Group Inc. (OMC) : Free Stock Analysis Report
Insperity, Inc. (NSP) : Free Stock Analysis Report
