
 Yahoo Finance
 InnoTek's (SGX:M14) earnings trajectory could turn positive as the stock rallies 18% this past week
InnoTek Limited (SGX:M14) shareholders should be happy to see the share price up 22% in the last month. But that doesn't help the fact that the three year return is less impressive. In fact, the share price is down 41% in the last three years, falling well short of the market return.
While the stock has risen 18% in the past week but long term shareholders are still in the red, let's see what the fundamentals can tell us.
View our latest analysis for InnoTek
To quote Buffett, 'Ships will sail around the world but the Flat Earth Society will flourish. There will continue to be wide discrepancies between price and value in the marketplace...' One way to examine how market sentiment has changed over time is to look at the interaction between a company's share price and its earnings per share (EPS).
During the three years that the share price fell, InnoTek's earnings per share (EPS) dropped by 31% each year. This fall in the EPS is worse than the 16% compound annual share price fall. So, despite the prior disappointment, shareholders must have some confidence the situation will improve, longer term.
You can see how EPS has changed over time in the image below (click on the chart to see the exact values).
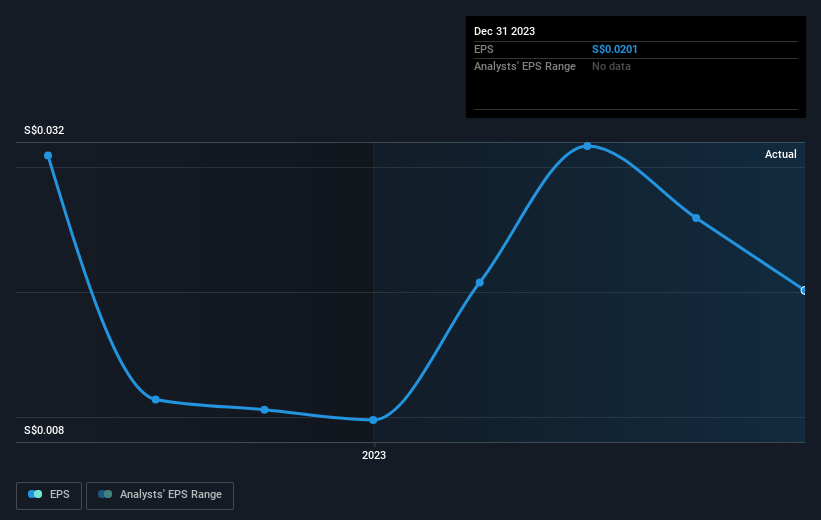
This free interactive report on InnoTek's earnings, revenue and cash flow is a great place to start, if you want to investigate the stock further.
What About Dividends?
As well as measuring the share price return, investors should also consider the total shareholder return (TSR). The TSR incorporates the value of any spin-offs or discounted capital raisings, along with any dividends, based on the assumption that the dividends are reinvested. So for companies that pay a generous dividend, the TSR is often a lot higher than the share price return. We note that for InnoTek the TSR over the last 3 years was -34%, which is better than the share price return mentioned above. And there's no prize for guessing that the dividend payments largely explain the divergence!
A Different Perspective
We're pleased to report that InnoTek shareholders have received a total shareholder return of 13% over one year. That's including the dividend. Since the one-year TSR is better than the five-year TSR (the latter coming in at 1.6% per year), it would seem that the stock's performance has improved in recent times. Given the share price momentum remains strong, it might be worth taking a closer look at the stock, lest you miss an opportunity. I find it very interesting to look at share price over the long term as a proxy for business performance. But to truly gain insight, we need to consider other information, too. For instance, we've identified 3 warning signs for InnoTek (2 can't be ignored) that you should be aware of.
If you like to buy stocks alongside management, then you might just love this free list of companies. (Hint: insiders have been buying them).
Please note, the market returns quoted in this article reflect the market weighted average returns of stocks that currently trade on Singaporean exchanges.
Have feedback on this article? Concerned about the content? Get in touch with us directly. Alternatively, email editorial-team (at) simplywallst.com.
This article by Simply Wall St is general in nature. We provide commentary based on historical data and analyst forecasts only using an unbiased methodology and our articles are not intended to be financial advice. It does not constitute a recommendation to buy or sell any stock, and does not take account of your objectives, or your financial situation. We aim to bring you long-term focused analysis driven by fundamental data. Note that our analysis may not factor in the latest price-sensitive company announcements or qualitative material. Simply Wall St has no position in any stocks mentioned.
