
 Yahoo Finance
 Is ICON Public Limited Company’s (NASDAQ:ICLR) 23.92% ROE Strong Compared To Its Industry?

The content of this article will benefit those of you who are starting to educate yourself about investing in the stock market and want a simplistic look at the return on ICON Public Limited Company (NASDAQ:ICLR) stock.
ICON Public Limited Company (NASDAQ:ICLR) delivered an ROE of 23.92% over the past 12 months, which is an impressive feat relative to its industry average of 10.88% during the same period. Superficially, this looks great since we know that ICLR has generated big profits with little equity capital; however, ROE doesn’t tell us how much ICLR has borrowed in debt. In this article, we’ll closely examine some factors like financial leverage to evaluate the sustainability of ICLR’s ROE. See our latest analysis for ICON
What you must know about ROE
Firstly, Return on Equity, or ROE, is simply the percentage of last years’ earning against the book value of shareholders’ equity. It essentially shows how much the company can generate in earnings given the amount of equity it has raised. Generally speaking, a higher ROE is preferred; however, there are other factors we must also consider before making any conclusions.
Return on Equity = Net Profit ÷ Shareholders Equity
ROE is assessed against cost of equity, which is measured using the Capital Asset Pricing Model (CAPM) – but let’s not dive into the details of that today. For now, let’s just look at the cost of equity number for ICON, which is 9.03%. Since ICON’s return covers its cost in excess of 14.89%, its use of equity capital is efficient and likely to be sustainable. Simply put, ICON pays less for its capital than what it generates in return. ROE can be broken down into three different ratios: net profit margin, asset turnover, and financial leverage. This is called the Dupont Formula:
Dupont Formula
ROE = profit margin × asset turnover × financial leverage
ROE = (annual net profit ÷ sales) × (sales ÷ assets) × (assets ÷ shareholders’ equity)
ROE = annual net profit ÷ shareholders’ equity
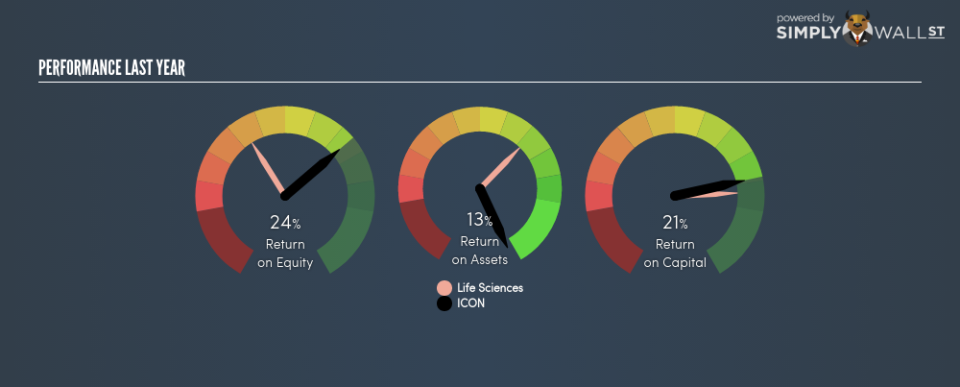
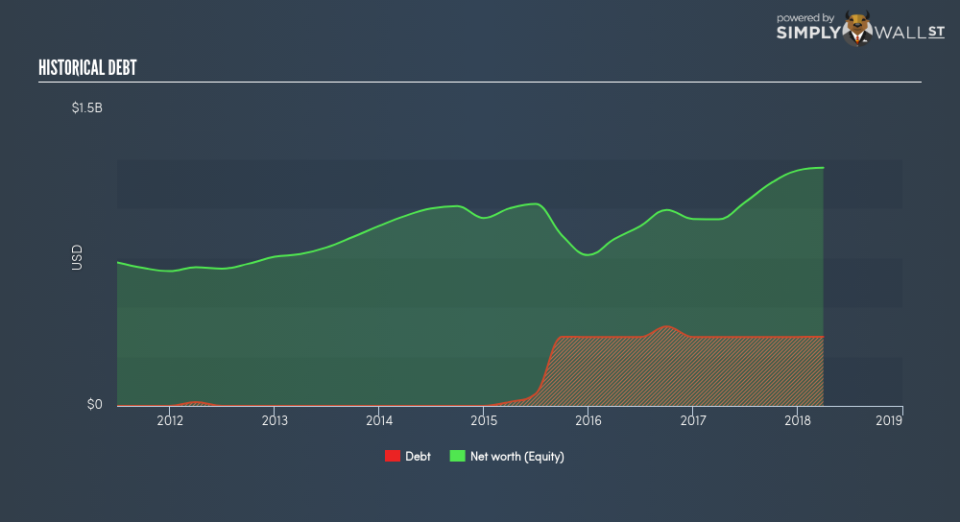
Essentially, profit margin shows how much money the company makes after paying for all its expenses. The other component, asset turnover, illustrates how much revenue ICON can make from its asset base. And finally, financial leverage is simply how much of assets are funded by equity, which exhibits how sustainable the company’s capital structure is. Since ROE can be artificially increased through excessive borrowing, we should check ICON’s historic debt-to-equity ratio. The debt-to-equity ratio currently stands at a low 28.96%, meaning the above-average ROE is due to its capacity to produce profit growth without a huge debt burden.
Next Steps:
While ROE is a relatively simple calculation, it can be broken down into different ratios, each telling a different story about the strengths and weaknesses of a company. ICON exhibits a strong ROE against its peers, as well as sufficient returns to cover its cost of equity. ROE is not likely to be inflated by excessive debt funding, giving shareholders more conviction in the sustainability of high returns. Although ROE can be a useful metric, it is only a small part of diligent research.
For ICON, I’ve compiled three fundamental factors you should look at:
Financial Health: Does it have a healthy balance sheet? Take a look at our free balance sheet analysis with six simple checks on key factors like leverage and risk.
Valuation: What is ICON worth today? Is the stock undervalued, even when its growth outlook is factored into its intrinsic value? The intrinsic value infographic in our free research report helps visualize whether ICON is currently mispriced by the market.
Other High-Growth Alternatives : Are there other high-growth stocks you could be holding instead of ICON? Explore our interactive list of stocks with large growth potential to get an idea of what else is out there you may be missing!
To help readers see pass the short term volatility of the financial market, we aim to bring you a long-term focused research analysis purely driven by fundamental data. Note that our analysis does not factor in the latest price sensitive company announcements.
The author is an independent contributor and at the time of publication had no position in the stocks mentioned.
