
 Yahoo Finance
 Huntington (HBAN) Q1 Earnings & Revenues Beat, Costs Rise Y/Y
Huntington Bancshares Incorporated HBAN has reported first-quarter 2024 adjusted earnings per share of 28 cents (excluding FDIC Deposit Insurance Fund special assessment), surpassing the Zacks Consensus Estimate of 25 cents. In the prior-year quarter, the company reported earnings per share of 39 cents.
Results have reflected improvements in average loans and deposits. However, a fall in net interest income (NII) and elevated expenses were headwinds.
The company has reported a net income applicable to common shares of $383 million in the quarter, down 33% year over year.
Revenues Fall, Expenses Rise
Total revenues (on a fully taxable-equivalent or FTE basis) declined 8% year over year to $1.76 billion in the first quarter. The top line surpassed the consensus estimate of $1.74 billion.
NII (FTE basis) was $1.30 billion, down 8% from the prior-year quarter. The fall was due to a decline in the net interest margin (NIM), partially offset by an increase in average earning assets. NIM decreased 39 basis points to 3.01% in the reported quarter.
Non-interest income moved down 9% year over year to $467 million. The rise was largely due to a decline in capital markets and advisory fees, leasing revenues, and lower other non-interest income.
Non-interest expenses were up 5% year over year to $1.13 billion. This was mainly due to a rise in almost all the components of non-interest expenses, except for a decrease in the amortization of intangibles, lease financing equipment depreciation and a decline in net occupancy expenses.
The efficiency ratio was 63.7%, up from the year-ago quarter’s 55.6%. A rise in the efficiency ratio indicates a decrease in profitability.
As of Mar 31, 2024, average loans and leases at Huntington increased marginally on a sequential basis to $121.93 billion. Average core deposits increased marginally to $145 billion.
Credit Quality Deteriorates
Net charge-offs were $92 million or an annualized 0.30% of average total loans and leases in the reported quarter, up from $57 million or 0.19% in the prior year. The quarter-end allowance for credit losses increased to $2.40 billion from $2.29 billion in the prior-year quarter.
Further, the total non-performing assets were $738 million as of Dec 31, 2024, up from $578 million in the prior-year quarter. Also, in the first quarter, the company recorded a provision for credit losses of $107 million compared with $85 million in the year-ago quarter.
Capital Ratios Solid
The common equity tier 1 risk-based capital ratio was 10.2% in the quarter compared with 9.5% in the year-ago period. The regulatory Tier 1 risk-based capital ratio was 10.2 %, up from 9.5% in the comparable period in 2023. The tangible common equity to tangible assets ratio in the first quarter was 6%, up from 5.8% in the year-ago quarter.
Our Viewpoint
Huntington’s inorganic expansion moves are likely to bolster its revenue growth in the near term. Its elevated non-interest expenses are expected to keep the bottom line under pressure in the upcoming period. Further, any deterioration in the balance sheet might affect its financials.
Huntington Bancshares Incorporated Price, Consensus and EPS Surprise
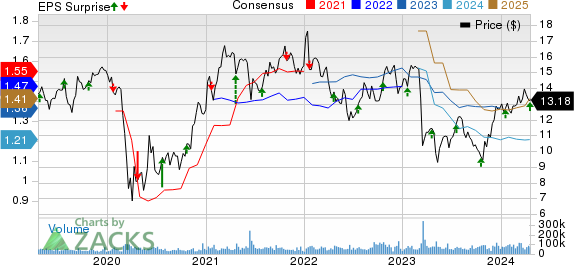
Huntington Bancshares Incorporated price-consensus-eps-surprise-chart | Huntington Bancshares Incorporated Quote
Currently, Huntington carries a Zacks Rank #3 (Hold). You can see the complete list of today’s Zacks #1 Rank (Strong Buy) stocks here.
Performance of Other Banks
State Street’s STT first-quarter 2024 adjusted earnings of $1.69 per share surpassed the Zacks Consensus Estimate of $1.48. The bottom line increased 11.2% from the prior-year quarter.
STT’s results were primarily aided by growth in fee revenues and lower provisions. Also, the company witnessed improvements in the total assets under custody and AUM balances. However, lower NIR and higher expenses were major headwinds.
Hancock Whitney Corp.’s HWC first-quarter 2024 adjusted earnings per share of $1.28 beat the Zacks Consensus Estimate of $1.18. However, the bottom line compared unfavorably with the $1.45 registered in the year-ago quarter.
HWC’s results were aided by an increase in non-interest income. Also, marginally higher loan balances were tailwinds. However, a decline in NII, and higher expenses and provisions were the undermining factors.
Want the latest recommendations from Zacks Investment Research? Today, you can download 7 Best Stocks for the Next 30 Days. Click to get this free report
State Street Corporation (STT) : Free Stock Analysis Report
Huntington Bancshares Incorporated (HBAN) : Free Stock Analysis Report
Hancock Whitney Corporation (HWC) : Free Stock Analysis Report
