
 Yahoo Finance
 Hor Kew (SGX:BBP) Is Looking To Continue Growing Its Returns On Capital
What trends should we look for it we want to identify stocks that can multiply in value over the long term? Amongst other things, we'll want to see two things; firstly, a growing return on capital employed (ROCE) and secondly, an expansion in the company's amount of capital employed. If you see this, it typically means it's a company with a great business model and plenty of profitable reinvestment opportunities. Speaking of which, we noticed some great changes in Hor Kew's (SGX:BBP) returns on capital, so let's have a look.
Return On Capital Employed (ROCE): What Is It?
For those who don't know, ROCE is a measure of a company's yearly pre-tax profit (its return), relative to the capital employed in the business. The formula for this calculation on Hor Kew is:
Return on Capital Employed = Earnings Before Interest and Tax (EBIT) ÷ (Total Assets - Current Liabilities)
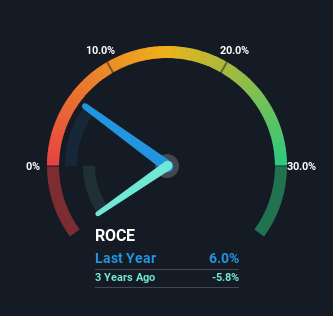
0.06 = S$6.1m ÷ (S$159m - S$57m) (Based on the trailing twelve months to December 2023).
So, Hor Kew has an ROCE of 6.0%. In absolute terms, that's a low return but it's around the Construction industry average of 6.8%.
View our latest analysis for Hor Kew
While the past is not representative of the future, it can be helpful to know how a company has performed historically, which is why we have this chart above. If you're interested in investigating Hor Kew's past further, check out this free graph covering Hor Kew's past earnings, revenue and cash flow.
What Does the ROCE Trend For Hor Kew Tell Us?
Shareholders will be relieved that Hor Kew has broken into profitability. The company was generating losses five years ago, but has managed to turn it around and as we saw earlier is now earning 6.0%, which is always encouraging. On top of that, what's interesting is that the amount of capital being employed has remained steady, so the business hasn't needed to put any additional money to work to generate these higher returns. That being said, while an increase in efficiency is no doubt appealing, it'd be helpful to know if the company does have any investment plans going forward. Because in the end, a business can only get so efficient.
What We Can Learn From Hor Kew's ROCE
As discussed above, Hor Kew appears to be getting more proficient at generating returns since capital employed has remained flat but earnings (before interest and tax) are up. And investors seem to expect more of this going forward, since the stock has rewarded shareholders with a 63% return over the last five years. With that being said, we still think the promising fundamentals mean the company deserves some further due diligence.
Like most companies, Hor Kew does come with some risks, and we've found 2 warning signs that you should be aware of.
For those who like to invest in solid companies, check out this free list of companies with solid balance sheets and high returns on equity.
Have feedback on this article? Concerned about the content? Get in touch with us directly. Alternatively, email editorial-team (at) simplywallst.com.
This article by Simply Wall St is general in nature. We provide commentary based on historical data and analyst forecasts only using an unbiased methodology and our articles are not intended to be financial advice. It does not constitute a recommendation to buy or sell any stock, and does not take account of your objectives, or your financial situation. We aim to bring you long-term focused analysis driven by fundamental data. Note that our analysis may not factor in the latest price-sensitive company announcements or qualitative material. Simply Wall St has no position in any stocks mentioned.
