
 Yahoo Finance
 Hong Fok (SGX:H30) shareholders have earned a 7.6% CAGR over the last three years
By buying an index fund, investors can approximate the average market return. But if you choose individual stocks with prowess, you can make superior returns. For example, Hong Fok Corporation Limited (SGX:H30) shareholders have seen the share price rise 24% over three years, well in excess of the market decline (7.7%, not including dividends).
With that in mind, it's worth seeing if the company's underlying fundamentals have been the driver of long term performance, or if there are some discrepancies.
Check out our latest analysis for Hong Fok
In his essay The Superinvestors of Graham-and-Doddsville Warren Buffett described how share prices do not always rationally reflect the value of a business. One imperfect but simple way to consider how the market perception of a company has shifted is to compare the change in the earnings per share (EPS) with the share price movement.
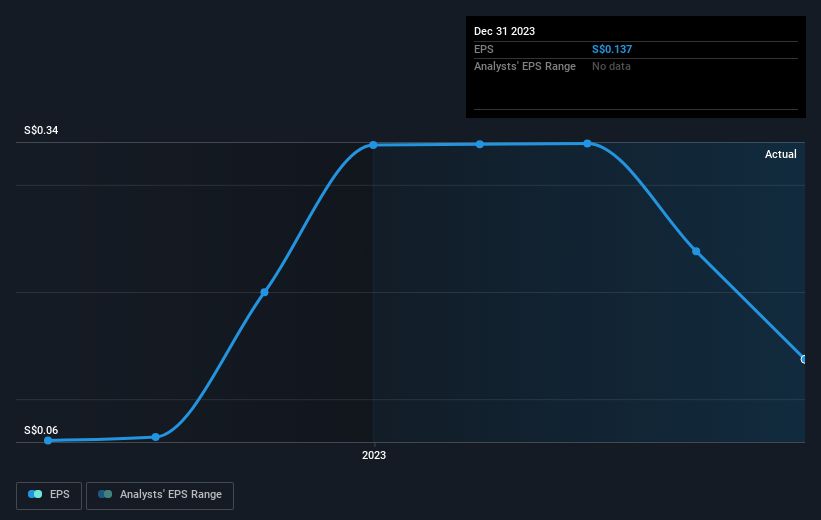
Hong Fok became profitable within the last three years. So we would expect a higher share price over the period.
The company's earnings per share (over time) is depicted in the image below (click to see the exact numbers).
Dive deeper into Hong Fok's key metrics by checking this interactive graph of Hong Fok's earnings, revenue and cash flow.
A Different Perspective
While the broader market lost about 3.4% in the twelve months, Hong Fok shareholders did even worse, losing 15% (even including dividends). However, it could simply be that the share price has been impacted by broader market jitters. It might be worth keeping an eye on the fundamentals, in case there's a good opportunity. On the bright side, long term shareholders have made money, with a gain of 1.6% per year over half a decade. If the fundamental data continues to indicate long term sustainable growth, the current sell-off could be an opportunity worth considering. It's always interesting to track share price performance over the longer term. But to understand Hong Fok better, we need to consider many other factors. Like risks, for instance. Every company has them, and we've spotted 3 warning signs for Hong Fok (of which 1 is significant!) you should know about.
For those who like to find winning investments this free list of growing companies with recent insider purchasing, could be just the ticket.
Please note, the market returns quoted in this article reflect the market weighted average returns of stocks that currently trade on Singaporean exchanges.
Have feedback on this article? Concerned about the content? Get in touch with us directly. Alternatively, email editorial-team (at) simplywallst.com.
This article by Simply Wall St is general in nature. We provide commentary based on historical data and analyst forecasts only using an unbiased methodology and our articles are not intended to be financial advice. It does not constitute a recommendation to buy or sell any stock, and does not take account of your objectives, or your financial situation. We aim to bring you long-term focused analysis driven by fundamental data. Note that our analysis may not factor in the latest price-sensitive company announcements or qualitative material. Simply Wall St has no position in any stocks mentioned.
