
 Yahoo Finance
 Is Herige’s (EPA:HERIG) Balance Sheet Strong Enough To Weather A Storm?

Investors are always looking for growth in small-cap stocks like Herige (ENXTPA:HERIG), with a market cap of €117.42M. However, an important fact which most ignore is: how financially healthy is the business? So, understanding the company’s financial health becomes vital, as mismanagement of capital can lead to bankruptcies, which occur at a higher rate for small-caps. Here are few basic financial health checks you should consider before taking the plunge. However, given that I have not delve into the company-specifics, I’d encourage you to dig deeper yourself into HERIG here.
Does HERIG generate an acceptable amount of cash through operations?
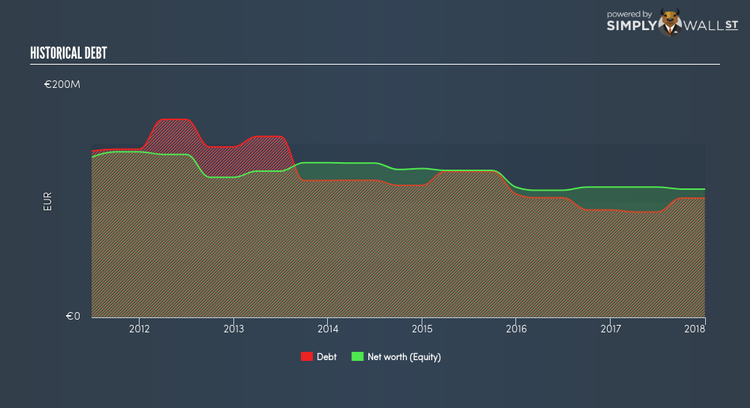
Over the past year, HERIG has ramped up its debt from €92.78M to €102.97M , which comprises of short- and long-term debt. With this increase in debt, HERIG’s cash and short-term investments stands at €39.49M , ready to deploy into the business. Additionally, HERIG has produced cash from operations of €20.28M in the last twelve months, resulting in an operating cash to total debt ratio of 19.70%, indicating that HERIG’s debt is not appropriately covered by operating cash. This ratio can also be a sign of operational efficiency as an alternative to return on assets. In HERIG’s case, it is able to generate 0.2x cash from its debt capital.
Can HERIG pay its short-term liabilities?
With current liabilities at €167.43M, the company has been able to meet these obligations given the level of current assets of €214.75M, with a current ratio of 1.28x. Generally, for Trade Distributors companies, this is a reasonable ratio since there is a bit of a cash buffer without leaving too much capital in a low-return environment.
Can HERIG service its debt comfortably?
With a debt-to-equity ratio of 93.02%, HERIG can be considered as an above-average leveraged company. This is not uncommon for a small-cap company given that debt tends to be lower-cost and at times, more accessible. No matter how high the company’s debt, if it can easily cover the interest payments, it’s considered to be efficient with its use of excess leverage. A company generating earnings after interest and tax at least three times its net interest payments is considered financially sound. In HERIG’s case, the ratio of 5.94x suggests that interest is appropriately covered, which means that lenders may be less hesitant to lend out more funding as HERIG’s high interest coverage is seen as responsible and safe practice.
Next Steps:
At its current level of cash flow coverage, HERIG has room for improvement to better cushion for events which may require debt repayment. Though, the company will be able to pay all of its upcoming liabilities from its current short-term assets. Keep in mind I haven’t considered other factors such as how HERIG has been performing in the past. You should continue to research Herige to get a more holistic view of the stock by looking at:
Future Outlook: What are well-informed industry analysts predicting for HERIG’s future growth? Take a look at our free research report of analyst consensus for HERIG’s outlook.
Historical Performance: What has HERIG’s returns been like over the past? Go into more detail in the past track record analysis and take a look at the free visual representations of our analysis for more clarity.
Other High-Performing Stocks: Are there other stocks that provide better prospects with proven track records? Explore our free list of these great stocks here.
To help readers see pass the short term volatility of the financial market, we aim to bring you a long-term focused research analysis purely driven by fundamental data. Note that our analysis does not factor in the latest price sensitive company announcements.
The author is an independent contributor and at the time of publication had no position in the stocks mentioned.
