
 Yahoo Finance
 Here's What's Concerning About Kinaxis' (TSE:KXS) Returns On Capital
If we want to find a stock that could multiply over the long term, what are the underlying trends we should look for? Firstly, we'd want to identify a growing return on capital employed (ROCE) and then alongside that, an ever-increasing base of capital employed. Basically this means that a company has profitable initiatives that it can continue to reinvest in, which is a trait of a compounding machine. However, after investigating Kinaxis (TSE:KXS), we don't think it's current trends fit the mold of a multi-bagger.
Return On Capital Employed (ROCE): What Is It?
For those that aren't sure what ROCE is, it measures the amount of pre-tax profits a company can generate from the capital employed in its business. The formula for this calculation on Kinaxis is:
Return on Capital Employed = Earnings Before Interest and Tax (EBIT) ÷ (Total Assets - Current Liabilities)
0.028 = US$14m ÷ (US$692m - US$183m) (Based on the trailing twelve months to December 2023).
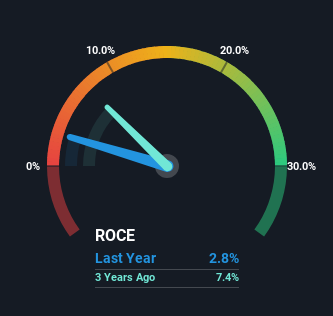
So, Kinaxis has an ROCE of 2.8%. In absolute terms, that's a low return and it also under-performs the Software industry average of 10%.
See our latest analysis for Kinaxis
In the above chart we have measured Kinaxis' prior ROCE against its prior performance, but the future is arguably more important. If you'd like, you can check out the forecasts from the analysts covering Kinaxis for free.
The Trend Of ROCE
In terms of Kinaxis' historical ROCE movements, the trend isn't fantastic. To be more specific, ROCE has fallen from 11% over the last five years. However, given capital employed and revenue have both increased it appears that the business is currently pursuing growth, at the consequence of short term returns. And if the increased capital generates additional returns, the business, and thus shareholders, will benefit in the long run.
The Bottom Line On Kinaxis' ROCE
While returns have fallen for Kinaxis in recent times, we're encouraged to see that sales are growing and that the business is reinvesting in its operations. And the stock has done incredibly well with a 102% return over the last five years, so long term investors are no doubt ecstatic with that result. So should these growth trends continue, we'd be optimistic on the stock going forward.
One more thing to note, we've identified 2 warning signs with Kinaxis and understanding these should be part of your investment process.
While Kinaxis may not currently earn the highest returns, we've compiled a list of companies that currently earn more than 25% return on equity. Check out this free list here.
Have feedback on this article? Concerned about the content? Get in touch with us directly. Alternatively, email editorial-team (at) simplywallst.com.
This article by Simply Wall St is general in nature. We provide commentary based on historical data and analyst forecasts only using an unbiased methodology and our articles are not intended to be financial advice. It does not constitute a recommendation to buy or sell any stock, and does not take account of your objectives, or your financial situation. We aim to bring you long-term focused analysis driven by fundamental data. Note that our analysis may not factor in the latest price-sensitive company announcements or qualitative material. Simply Wall St has no position in any stocks mentioned.
