
 Yahoo Finance
 Heeton Holdings (SGX:5DP) Shareholders Will Want The ROCE Trajectory To Continue
Did you know there are some financial metrics that can provide clues of a potential multi-bagger? Firstly, we'll want to see a proven return on capital employed (ROCE) that is increasing, and secondly, an expanding base of capital employed. Basically this means that a company has profitable initiatives that it can continue to reinvest in, which is a trait of a compounding machine. Speaking of which, we noticed some great changes in Heeton Holdings' (SGX:5DP) returns on capital, so let's have a look.
Return On Capital Employed (ROCE): What Is It?
For those who don't know, ROCE is a measure of a company's yearly pre-tax profit (its return), relative to the capital employed in the business. Analysts use this formula to calculate it for Heeton Holdings:
Return on Capital Employed = Earnings Before Interest and Tax (EBIT) ÷ (Total Assets - Current Liabilities)
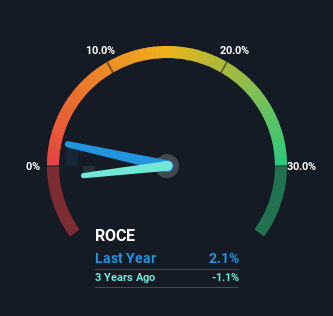
0.021 = S$18m ÷ (S$976m - S$128m) (Based on the trailing twelve months to December 2023).
So, Heeton Holdings has an ROCE of 2.1%. In absolute terms, that's a low return and it also under-performs the Hospitality industry average of 4.1%.
Check out our latest analysis for Heeton Holdings
While the past is not representative of the future, it can be helpful to know how a company has performed historically, which is why we have this chart above. If you're interested in investigating Heeton Holdings' past further, check out this free graph covering Heeton Holdings' past earnings, revenue and cash flow.
So How Is Heeton Holdings' ROCE Trending?
Even though ROCE is still low in absolute terms, it's good to see it's heading in the right direction. More specifically, while the company has kept capital employed relatively flat over the last five years, the ROCE has climbed 235% in that same time. So our take on this is that the business has increased efficiencies to generate these higher returns, all the while not needing to make any additional investments. On that front, things are looking good so it's worth exploring what management has said about growth plans going forward.
In Conclusion...
In summary, we're delighted to see that Heeton Holdings has been able to increase efficiencies and earn higher rates of return on the same amount of capital. Given the stock has declined 10% in the last five years, this could be a good investment if the valuation and other metrics are also appealing. With that in mind, we believe the promising trends warrant this stock for further investigation.
On a final note, we found 3 warning signs for Heeton Holdings (2 are potentially serious) you should be aware of.
If you want to search for solid companies with great earnings, check out this free list of companies with good balance sheets and impressive returns on equity.
Have feedback on this article? Concerned about the content? Get in touch with us directly. Alternatively, email editorial-team (at) simplywallst.com.
This article by Simply Wall St is general in nature. We provide commentary based on historical data and analyst forecasts only using an unbiased methodology and our articles are not intended to be financial advice. It does not constitute a recommendation to buy or sell any stock, and does not take account of your objectives, or your financial situation. We aim to bring you long-term focused analysis driven by fundamental data. Note that our analysis may not factor in the latest price-sensitive company announcements or qualitative material. Simply Wall St has no position in any stocks mentioned.
