
 Yahoo Finance
 HCI Group (HCI) Q1 Earnings & Revenues Top on Higher Premiums
HCI Group HCI reported first-quarter 2024 earnings of $3.65 per share, which beat the Zacks Consensus Estimate by 33.2%. Quarterly earnings more than doubled year over year.
The quarterly results reflected better performance at Homeowner Choice and TypTap Insurance Company, partially offset by a decrease in net investment income and higher expenses.
Behind the Headlines
Gross premiums earned of $256.6 million increased 42.5% year over year. Quarterly results include $67 million of premium from the assumption of policies from Citizens.
Net premiums earned increased 72.1% year over year to $188.6 million.
Operating revenues increased 60.1% year over year to $206.6 million on account of a rise in net premiums earned. The top line beat the Zacks Consensus Estimate by 9.2%.
HCI Group, Inc. Price, Consensus and EPS Surprise
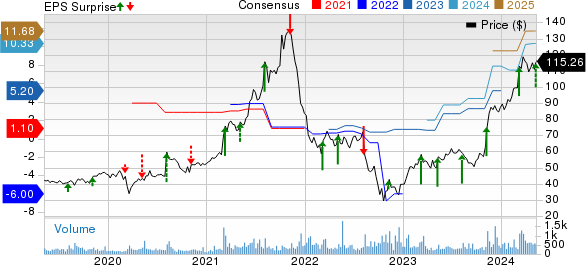
HCI Group, Inc. price-consensus-eps-surprise-chart | HCI Group, Inc. Quote
Net investment income was $14.1 million, down 17.5% year over year. The prior year quarter figure included a gain from the sale of two real estate investment properties that was absent this time around.
Total expenses increased 22% year over year to $129.2 million due to higher losses and loss adjustment expenses, interest expenses and general and administrative personnel expenses, as well as other operating expenses.
Losses and loss adjustment expenses were $80 million, up 32% year over year, primarily due to due to the growth in policy count and premiums.
Losses and loss adjustment expenses, as a percent of gross premiums earned, declined to 31.1% from 33.6% in the year-ago quarter.
Financial Update
HCI Group exited first-quarter 2024 with cash and cash equivalents of $658.7 million, which surged 42.5% from the 2023-end level. Total investments decreased 18.4% from 2023-end to $615.9 million at the end of the first quarter of 2024.
Long-term debt of $184.7 million decreased 11.4% from the 2023-end figure.
As of Mar 31, 2024, total shareholders’ equity was $397.9 million, up 21.6% from the level at 2023-end.
Book value per share increased 83.6% from 2023-end to $38.50 at first-quarter 2024 end.
Zacks Rank
HCI Group currently has a Zacks Rank #1 (Strong Buy). You can see the complete list of today’s Zacks #1 Rank stocks here.
Performance of Other Property and Casualty Insurers
The Travelers Companies TRV reported first-quarter 2024 core income of $4.69 per share, which missed the Zacks Consensus Estimate of $4.75 on higher-than-expected catastrophe loss. The bottom line increased 14.1% year over year, driven by higher underlying underwriting gain and higher net investment income, partially offset by higher catastrophe losses. Travelers’ total revenues increased 15.3% from the year-ago quarter to $11.2 billion, primarily driven by higher premiums. The top-line figure beat the Zacks Consensus Estimate by 0.1%.
Net written premiums increased 8% year over year to about $10.2 billion, driven by strong growth across all three segments. The figure was higher than our estimate of $9.9 billion. Travelers witnessed an underwriting gain of $1.4 billion, up 57.3% year over year, driven by higher business volumes.
Consolidated underlying combined ratio of 87.7 improved 290 bps year over year. The combined ratio improved 150 bps year over year to 93.9 due to an improvement in the underlying combined ratio, partially offset by higher catastrophe losses and lower net favorable prior-year reserve development. The Zacks Consensus Estimate was pegged at 94.
Progressive Corporation’s PGR first-quarter 2024 earnings per share of $3.83 beat the Zacks Consensus Estimate of $3.20. The bottom line improved nearly eight times year over year. Operating revenues of $17.1 billion beat the Zacks Consensus Estimate by 2.4% and increased 20.1% year over year.
Net premiums earned grew 19% to $16 billion and beat our estimate of $14.4 billion. Combined ratio — the percentage of premiums paid out as claims and expenses — improved 1,290 bps from the prior-year quarter’s level to 86.1.
RLI Corp. RLI reported first-quarter 2024 operating earnings of $1.89 per share, beating the Zacks Consensus Estimate as well as the year-ago number by 16%. The quarterly results reflected continued premium growth across all product segments. Operating revenues for the reported quarter were $394 million, up 17.6% year over year, driven by 17% higher net premiums earned and 21.3% higher net investment income. The top line, however, missed the Zacks Consensus Estimate by 0.1%.
Gross premiums written increased 13% year over year to $468 million. This uptick can be attributed to the solid performance of the Casualty (up 12.6%), Property (up 13.5%) and Surety (up 12.1%) segments. Our estimate was $511 million. Underwriting income of $77.7 million increased 16%. Combined ratio deteriorated 60 bps year over year to 78.5. The Zacks Consensus Estimate for the metric was pegged at 85, while our estimate was 77.7.
Want the latest recommendations from Zacks Investment Research? Today, you can download 7 Best Stocks for the Next 30 Days. Click to get this free report
RLI Corp. (RLI) : Free Stock Analysis Report
The Travelers Companies, Inc. (TRV) : Free Stock Analysis Report
The Progressive Corporation (PGR) : Free Stock Analysis Report
HCI Group, Inc. (HCI) : Free Stock Analysis Report
