
 Yahoo Finance
 Gold Sinks to Pivotal Support, SPX 500 Waiting for Direction Cues
DailyFX.com -
Talking Points:
US Dollar Rebound Capped at Trend Line Resistance Barrier
S&P 500 Waiting for Direction Cues Within Familiar Range
Crude Oil in Digestion Mode, Gold Nears Top Confirmation
Can’t access the Dow Jones FXCM US Dollar Index? Try the USD basket on Mirror Trader. **
US DOLLAR TECHNICAL ANALYSIS – Prices transitioned into digestion mode after bouncing to retest a recently broken rising trend. A daily close above the 23.6% Fibonacci expansion at 12027 exposes the trend line support-turned-resistance at 12058. Alternatively, a move below the 14.6% expansion at 11989 opens the door for a challenge of the 50% Fib retracement at 11950.retracement at 11950.
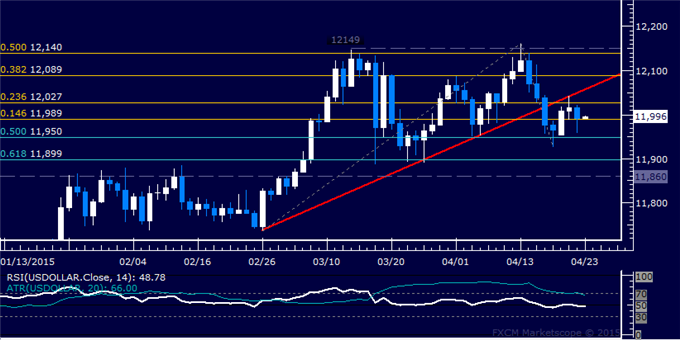
Daily Chart - Created Using FXCM Marketscope
** The Dow Jones FXCM US Dollar Index and the Mirror Trader USD basket are not the same product.
S&P 500 TECHNICAL ANALYSIS – Prices continue to hover below resistance in the 2111.00-19.40 area (23.6% Fibonacci expansion, February 25 high). A break above that on a daily closing basis exposing the 38.2% level at 2154.90. Alternatively, a reversal below the 14.6% Fib at 2084.00 targets the March 12 low at 2040.10.

Daily Chart - Created Using FXCM Marketscope
GOLD TECHNICAL ANALYSIS – Prices may be carving out a bearish Head and Shoulders top chart pattern. Confirmation is required on a daily close below 1185.23, the 23.6% Fibonacci expansion, with the first downside target thereafter coming in the 38.2% level (1161.16). Near-term resistance is at 1224.15, the April 6 high.
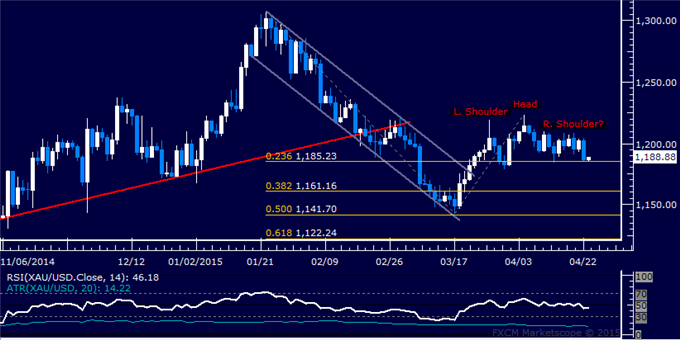
Daily Chart - Created Using FXCM Marketscope
CRUDE OIL TECHNICAL ANALYSIS – Prices transitioned back into consolidation mode after recoiling lower from resistance near the $65/barrel figure. A break below the 50% Fibonacci expansion at 61.46 exposes the 38.2% level at 59.35. Alternatively, a move above the 63.56-73 area (61.8% Fib, April 16 close) targets the 76.4% expansion at 66.16.

Daily Chart - Created Using FXCM Marketscope
--- Written by Ilya Spivak, Currency Strategist for DailyFX.com
To receive Ilya's analysis directly via email, please SIGN UP HERE
Contact and follow Ilya on Twitter: @IlyaSpivak
DailyFX provides forex news and technical analysis on the trends that influence the global currency markets.
Learn forex trading with a free practice account and trading charts from FXCM.
