
 Yahoo Finance
 Gold Price Futures (GC) Technical Analysis – Strengthens Over $1798.10, Weakens Under $1791.90
Comex gold futures are trading higher on Friday after easing the previous session due to pressure from a stronger U.S. Dollar. Meanwhile, it remains poised for a fifth straight weekly gain.
Traders remain fixated on a surge in new coronavirus figures, which can be a catalyst for a rally in gold if it leads to additional fiscal and monetary stimulus. Although it is currently being called a “safe-haven” asset, it’s actually and investment that is primarily influenced by the direction of U.S. Treasury yields. The true safe-havens are U.S. Treasury bonds, the Japanese Yen and the U.S. Dollar.
At 09:07 GMT, August Comex gold futures are trading $1812.90, up $9.10 or +0.50%.
If you look at the gain from the April high to Wednesday’s new contract high, you’ll notice a slowing in the long-term momentum. Gold is likely to remain supported over the long-run due to the size of the fiscal and monetary stimulus injected into the global economy, but it may be vulnerable to a short-term setback.
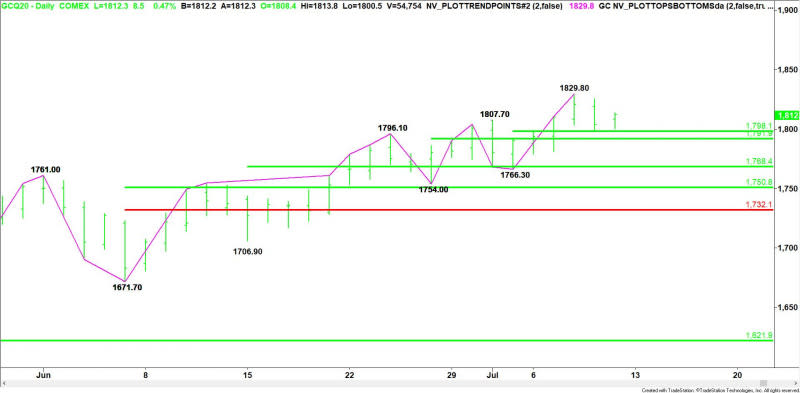
Daily Swing Chart Technical Analysis
The main trend is up according to the daily swing chart. A trade through $1829.80 will signal a resumption of the uptrend. The main trend will change to down on a move through $1766.30.
The first minor range is $1766.30 to $1829.80. Its retracement zone at $1798.10 is potential support. It actually stopped the selling on Thursday.
The second minor range is $1754.00 to $1829.80. Its 50% level at $1791.90 is another potential support level.
The short-term range is $1671.70 to $1829.80. If the trend changes to down then it’s like to correct into the retracement zone at $1750.80 to $1732.10.
Daily Swing Chart Technical Forecast
Based on the early price action, the direction on Friday is likely to be determined by trader reaction to the 50% level at $1798.10.
Bullish Scenario
A sustained move over $1798.10 will indicate the presence of buyers. This could trigger a quick test of a minor pivot at $1814.70. Counter-trend sellers could come in on a test of this level. They may be trying to form a secondary lower top.
Overcoming $1814.70 will indicate the buying is getting stronger. This could create the momentum needed to challenge $1829.80.
Bearish Scenario
A sustained move under $1798.10 will signal the presence of sellers. This could lead to a quick test of $1791.90. Since the main trend is up, buyers could come in on a test of this level. If it fails to hold then look for a potential acceleration to the downside with the next target a support cluster at $1768.40 to $1766.30.
For a look at all of today’s economic events, check out our economic calendar.
This article was originally posted on FX Empire
