
 Yahoo Finance
Gold's golden cross: The metal just formed a chart pattern that can signal a breakout


Gold is up nearly 10 percent this year and might be primed for more gains if a signal tracked by technical analysts triggered Monday is any guide.
A small gain was enough to push the metal's 50-day moving average price above the average price of the last 200 days, forming what's known as a "golden cross" in technical analysis circles. This is seen as a positive signal that demonstrates an asset is outperforming so well in the short-term that it may reverse a longer term downtrend.
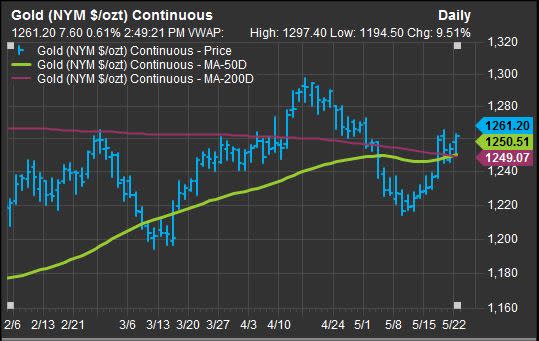
Gold since Feb. 6 with 50-day and 200-day moving averages:
Source: FactSet
Gold futures for June delivery rose 0.62 percent, or $7.80, to settle at $1,261.40 per ounce Monday, adding to its already strong yearly performance. The precious metal is outperforming the S&P 500 index, which is up more than 6.5 percent, as investors hedge against the possibility that the Trump administration does not succeed in pushing through its pro-growth agenda.
To be sure, some technical analysts believer there's more work to be done before this is a true gold breakout.
"In my humble opinion, gold remains in a tight jam," forming a so-called pennant pattern between a 16-year rising support level and a falling six-year resistance level, said Chris Kimble, founder of Kimble Charting Solutions, in a note.
"Pennant patterns tend to frustrate both bulls and bears, as little net progress is made, [and] only quick traders make money in this pattern," he said. "Pennant patterns don't suggest which direction any asset will take. They do historically suggest that when the breakout/breakdown takes place, it is usually a big one."
