
 Yahoo Finance
 Gilead Sciences Inc (NASDAQ:GILD): Should The Recent Earnings Drop Worry You?

In this commentary, I will examine Gilead Sciences Inc’s (NASDAQ:GILD) latest earnings update (31 March 2018) and compare these figures against its performance over the past couple of years, as well as how the rest of the biotechs industry performed. As an investor, I find it beneficial to assess GILD’s trend over the short-to-medium term in order to gauge whether or not the company is able to meet its goals, and ultimately sustainably grow over time. See our latest analysis for Gilead Sciences
Was GILD weak performance lately part of a long-term decline?
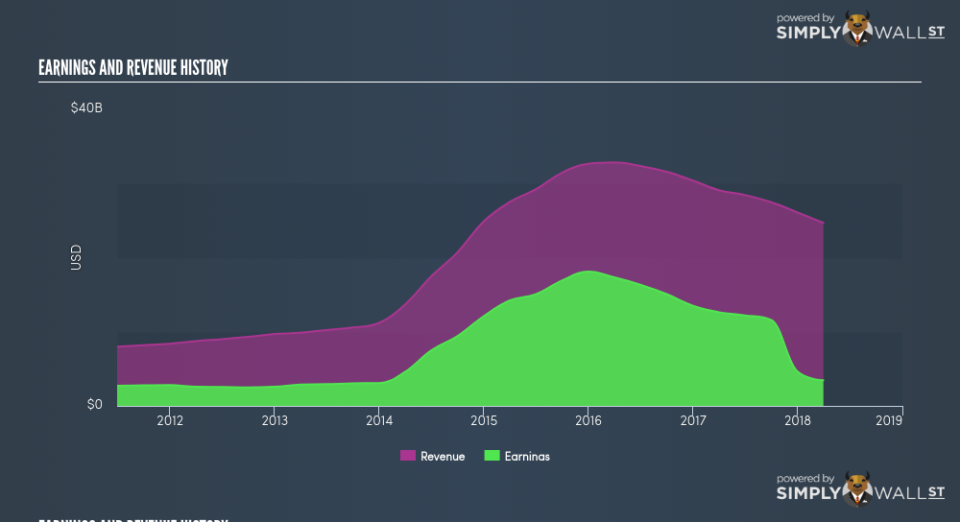
GILD’s trailing twelve-month earnings (from 31 March 2018) of US$3.46b has more than halved from US$13.50b in the prior year. Furthermore, this one-year growth rate has been lower than its average earnings growth rate over the past 5 years of 21.87%, indicating the rate at which GILD is growing has slowed down. Why is this? Well, let’s take a look at what’s going on with margins and if the rest of the industry is feeling the heat.
In the last couple of years, revenue growth has fallen behind which indicates that Gilead Sciences’s bottom line has been propelled by unsustainable cost-reductions. Looking at growth from a sector-level, the US biotechs industry has been growing its average earnings by double-digit 21.75% over the past year, and 17.77% over the past five years. This shows that whatever uplift the industry is enjoying, Gilead Sciences has not been able to leverage it as much as its industry peers.
In terms of returns from investment, Gilead Sciences has not invested its equity funds well, leading to a 16.87% return on equity (ROE), below the sensible minimum of 20%. Furthermore, its return on assets (ROA) of 7.05% is below the US Biotechs industry of 13.34%, indicating Gilead Sciences’s are utilized less efficiently. And finally, its return on capital (ROC), which also accounts for Gilead Sciences’s debt level, has declined over the past 3 years from 56.68% to 22.27%. This correlates with an increase in debt holding, with debt-to-equity ratio rising from 76.81% to 140.69% over the past 5 years.
What does this mean?
Though Gilead Sciences’s past data is helpful, it is only one aspect of my investment thesis. Typically companies that experience an extended period of reduction in earnings are going through some sort of reinvestment phase with the aim of keeping up with the latest industry disruption and growth. I recommend you continue to research Gilead Sciences to get a more holistic view of the stock by looking at:
Future Outlook: What are well-informed industry analysts predicting for GILD’s future growth? Take a look at our free research report of analyst consensus for GILD’s outlook.
Financial Health: Is GILD’s operations financially sustainable? Balance sheets can be hard to analyze, which is why we’ve done it for you. Check out our financial health checks here.
Other High-Performing Stocks: Are there other stocks that provide better prospects with proven track records? Explore our free list of these great stocks here.
NB: Figures in this article are calculated using data from the trailing twelve months from 31 March 2018. This may not be consistent with full year annual report figures.
To help readers see pass the short term volatility of the financial market, we aim to bring you a long-term focused research analysis purely driven by fundamental data. Note that our analysis does not factor in the latest price sensitive company announcements.
The author is an independent contributor and at the time of publication had no position in the stocks mentioned.
