
 Yahoo Finance
 Gentrack Group's (NZSE:GTK) Returns On Capital Not Reflecting Well On The Business
If you're looking at a mature business that's past the growth phase, what are some of the underlying trends that pop up? More often than not, we'll see a declining return on capital employed (ROCE) and a declining amount of capital employed. This indicates the company is producing less profit from its investments and its total assets are decreasing. And from a first read, things don't look too good at Gentrack Group (NZSE:GTK), so let's see why.
What Is Return On Capital Employed (ROCE)?
Just to clarify if you're unsure, ROCE is a metric for evaluating how much pre-tax income (in percentage terms) a company earns on the capital invested in its business. The formula for this calculation on Gentrack Group is:
Return on Capital Employed = Earnings Before Interest and Tax (EBIT) ÷ (Total Assets - Current Liabilities)
0.073 = NZ$15m ÷ (NZ$250m - NZ$49m) (Based on the trailing twelve months to September 2023).
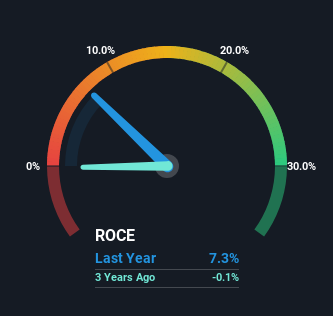
Thus, Gentrack Group has an ROCE of 7.3%. In absolute terms, that's a low return and it also under-performs the Software industry average of 13%.
See our latest analysis for Gentrack Group
In the above chart we have measured Gentrack Group's prior ROCE against its prior performance, but the future is arguably more important. If you're interested, you can view the analysts predictions in our free analyst report for Gentrack Group .
How Are Returns Trending?
There is reason to be cautious about Gentrack Group, given the returns are trending downwards. Unfortunately the returns on capital have diminished from the 10% that they were earning five years ago. And on the capital employed front, the business is utilizing roughly the same amount of capital as it was back then. Companies that exhibit these attributes tend to not be shrinking, but they can be mature and facing pressure on their margins from competition. So because these trends aren't typically conducive to creating a multi-bagger, we wouldn't hold our breath on Gentrack Group becoming one if things continue as they have.
On a side note, Gentrack Group's current liabilities have increased over the last five years to 20% of total assets, effectively distorting the ROCE to some degree. If current liabilities hadn't increased as much as they did, the ROCE could actually be even lower. Keep an eye on this ratio, because the business could encounter some new risks if this metric gets too high.
The Bottom Line On Gentrack Group's ROCE
All in all, the lower returns from the same amount of capital employed aren't exactly signs of a compounding machine. Yet despite these concerning fundamentals, the stock has performed strongly with a 43% return over the last five years, so investors appear very optimistic. In any case, the current underlying trends don't bode well for long term performance so unless they reverse, we'd start looking elsewhere.
If you'd like to know about the risks facing Gentrack Group, we've discovered 1 warning sign that you should be aware of.
If you want to search for solid companies with great earnings, check out this free list of companies with good balance sheets and impressive returns on equity.
Have feedback on this article? Concerned about the content? Get in touch with us directly. Alternatively, email editorial-team (at) simplywallst.com.
This article by Simply Wall St is general in nature. We provide commentary based on historical data and analyst forecasts only using an unbiased methodology and our articles are not intended to be financial advice. It does not constitute a recommendation to buy or sell any stock, and does not take account of your objectives, or your financial situation. We aim to bring you long-term focused analysis driven by fundamental data. Note that our analysis may not factor in the latest price-sensitive company announcements or qualitative material. Simply Wall St has no position in any stocks mentioned.
