
 Yahoo Finance
 Is Gama Aviation Plc’s (LON:GMAA) Balance Sheet A Threat To Its Future?

Gama Aviation Plc (LON:GMAA) is a small-cap stock with a market capitalization of UK£132.95m. While investors primarily focus on the growth potential and competitive landscape of the small-cap companies, they end up ignoring a key aspect, which could be the biggest threat to its existence: its financial health. Why is it important? Evaluating financial health as part of your investment thesis is vital, since poor capital management may bring about bankruptcies, which occur at a higher rate for small-caps. Here are few basic financial health checks you should consider before taking the plunge. However, since I only look at basic financial figures, I recommend you dig deeper yourself into GMAA here.
Does GMAA produce enough cash relative to debt?
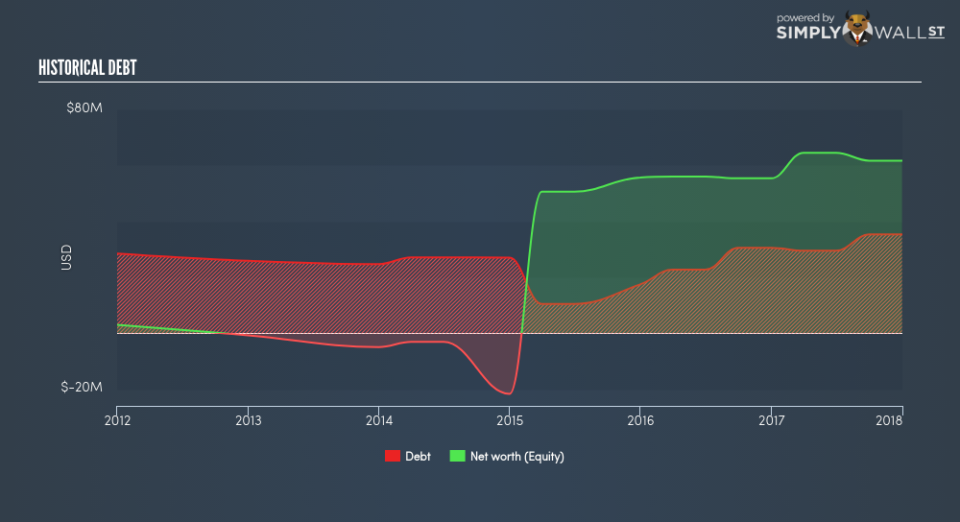
GMAA has built up its total debt levels in the last twelve months, from UK£30.56m to UK£0 , which is made up of current and long term debt. With this rise in debt, GMAA currently has UK£22.35m remaining in cash and short-term investments for investing into the business. On top of this, GMAA has produced UK£18.49m in operating cash flow in the last twelve months, leading to an operating cash to total debt ratio of 52.35%, signalling that GMAA’s debt is appropriately covered by operating cash. This ratio can also be interpreted as a measure of efficiency as an alternative to return on assets. In GMAA’s case, it is able to generate 0.52x cash from its debt capital.
Can GMAA pay its short-term liabilities?
At the current liabilities level of UK£91.73m liabilities, the company has not been able to meet these commitments with a current assets level of UK£81.27m, leading to a 0.89x current account ratio. which is under the appropriate industry ratio of 3x.
Does GMAA face the risk of succumbing to its debt-load?
With a debt-to-equity ratio of 57.24%, GMAA can be considered as an above-average leveraged company. This is not uncommon for a small-cap company given that debt tends to be lower-cost and at times, more accessible. We can check to see whether GMAA is able to meet its debt obligations by looking at the net interest coverage ratio. A company generating earnings before interest and tax (EBIT) at least three times its net interest payments is considered financially sound. In GMAA’s, case, the ratio of 8.38x suggests that interest is appropriately covered, which means that lenders may be less hesitant to lend out more funding as GMAA’s high interest coverage is seen as responsible and safe practice.
Next Steps:
GMAA’s high cash coverage means that, although its debt levels are high, the company is able to utilise its borrowings efficiently in order to generate cash flow. However, its lack of liquidity raises questions over current asset management practices for the small-cap. Keep in mind I haven’t considered other factors such as how GMAA has been performing in the past. I recommend you continue to research Gama Aviation to get a better picture of the stock by looking at:
Future Outlook: What are well-informed industry analysts predicting for GMAA’s future growth? Take a look at our free research report of analyst consensus for GMAA’s outlook.
Valuation: What is GMAA worth today? Is the stock undervalued, even when its growth outlook is factored into its intrinsic value? The intrinsic value infographic in our free research report helps visualize whether GMAA is currently mispriced by the market.
Other High-Performing Stocks: Are there other stocks that provide better prospects with proven track records? Explore our free list of these great stocks here.
To help readers see pass the short term volatility of the financial market, we aim to bring you a long-term focused research analysis purely driven by fundamental data. Note that our analysis does not factor in the latest price sensitive company announcements.
The author is an independent contributor and at the time of publication had no position in the stocks mentioned.
