
 Yahoo Finance
 Do Fundamentals Have Any Role To Play In Driving Q & M Dental Group (Singapore) Limited's (SGX:QC7) Stock Up Recently?
Most readers would already know that Q & M Dental Group (Singapore)'s (SGX:QC7) stock increased by 4.3% over the past three months. Given that stock prices are usually aligned with a company's financial performance in the long-term, we decided to investigate if the company's decent financials had a hand to play in the recent price move. In this article, we decided to focus on Q & M Dental Group (Singapore)'s ROE.
Return on equity or ROE is an important factor to be considered by a shareholder because it tells them how effectively their capital is being reinvested. In simpler terms, it measures the profitability of a company in relation to shareholder's equity.
See our latest analysis for Q & M Dental Group (Singapore)
How Do You Calculate Return On Equity?
The formula for ROE is:
Return on Equity = Net Profit (from continuing operations) ÷ Shareholders' Equity
So, based on the above formula, the ROE for Q & M Dental Group (Singapore) is:
11% = S$11m ÷ S$103m (Based on the trailing twelve months to December 2023).
The 'return' is the profit over the last twelve months. One way to conceptualize this is that for each SGD1 of shareholders' capital it has, the company made SGD0.11 in profit.
Why Is ROE Important For Earnings Growth?
We have already established that ROE serves as an efficient profit-generating gauge for a company's future earnings. Based on how much of its profits the company chooses to reinvest or "retain", we are then able to evaluate a company's future ability to generate profits. Generally speaking, other things being equal, firms with a high return on equity and profit retention, have a higher growth rate than firms that don’t share these attributes.
A Side By Side comparison of Q & M Dental Group (Singapore)'s Earnings Growth And 11% ROE
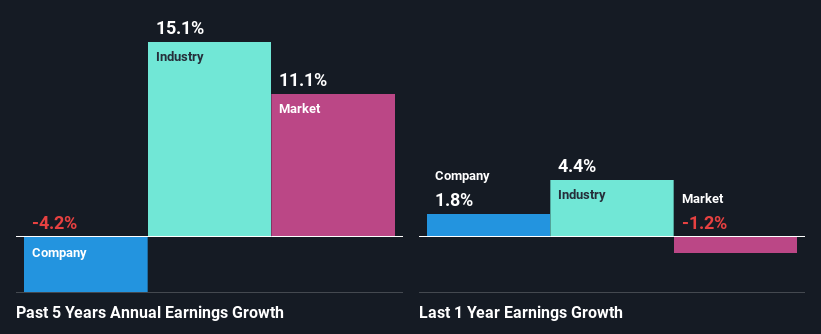
To start with, Q & M Dental Group (Singapore)'s ROE looks acceptable. Even when compared to the industry average of 9.6% the company's ROE looks quite decent. As you might expect, the 4.2% net income decline reported by Q & M Dental Group (Singapore) is a bit of a surprise. Based on this, we feel that there might be other reasons which haven't been discussed so far in this article that could be hampering the company's growth. Such as, the company pays out a huge portion of its earnings as dividends, or is faced with competitive pressures.
That being said, we compared Q & M Dental Group (Singapore)'s performance with the industry and were concerned when we found that while the company has shrunk its earnings, the industry has grown its earnings at a rate of 15% in the same 5-year period.
Earnings growth is a huge factor in stock valuation. It’s important for an investor to know whether the market has priced in the company's expected earnings growth (or decline). Doing so will help them establish if the stock's future looks promising or ominous. If you're wondering about Q & M Dental Group (Singapore)'s's valuation, check out this gauge of its price-to-earnings ratio, as compared to its industry.
Is Q & M Dental Group (Singapore) Efficiently Re-investing Its Profits?
Q & M Dental Group (Singapore)'s declining earnings is not surprising given how the company is spending most of its profits in paying dividends, judging by its three-year median payout ratio of 85% (or a retention ratio of 15%). With only very little left to reinvest into the business, growth in earnings is far from likely.
In addition, Q & M Dental Group (Singapore) has been paying dividends over a period of at least ten years suggesting that keeping up dividend payments is way more important to the management even if it comes at the cost of business growth. Our latest analyst data shows that the future payout ratio of the company is expected to drop to 68% over the next three years. Accordingly, the expected drop in the payout ratio explains the expected increase in the company's ROE to 17%, over the same period.
Summary
Overall, we feel that Q & M Dental Group (Singapore) certainly does have some positive factors to consider. Yet, the low earnings growth is a bit concerning, especially given that the company has a high rate of return. Investors could have benefitted from the high ROE, had the company been reinvesting more of its earnings. As discussed earlier, the company is retaining a small portion of its profits. Having said that, looking at current analyst estimates, we found that the company's earnings growth rate is expected to see a huge improvement. To know more about the company's future earnings growth forecasts take a look at this free report on analyst forecasts for the company to find out more.
Have feedback on this article? Concerned about the content? Get in touch with us directly. Alternatively, email editorial-team (at) simplywallst.com.
This article by Simply Wall St is general in nature. We provide commentary based on historical data and analyst forecasts only using an unbiased methodology and our articles are not intended to be financial advice. It does not constitute a recommendation to buy or sell any stock, and does not take account of your objectives, or your financial situation. We aim to bring you long-term focused analysis driven by fundamental data. Note that our analysis may not factor in the latest price-sensitive company announcements or qualitative material. Simply Wall St has no position in any stocks mentioned.
