
 Yahoo Finance
 Frequentis (ETR:FQT) Has More To Do To Multiply In Value Going Forward
If you're looking for a multi-bagger, there's a few things to keep an eye out for. One common approach is to try and find a company with returns on capital employed (ROCE) that are increasing, in conjunction with a growing amount of capital employed. This shows us that it's a compounding machine, able to continually reinvest its earnings back into the business and generate higher returns. With that in mind, the ROCE of Frequentis (ETR:FQT) looks decent, right now, so lets see what the trend of returns can tell us.
What Is Return On Capital Employed (ROCE)?
For those who don't know, ROCE is a measure of a company's yearly pre-tax profit (its return), relative to the capital employed in the business. Analysts use this formula to calculate it for Frequentis:
Return on Capital Employed = Earnings Before Interest and Tax (EBIT) ÷ (Total Assets - Current Liabilities)
0.13 = €28m ÷ (€357m - €150m) (Based on the trailing twelve months to June 2023).
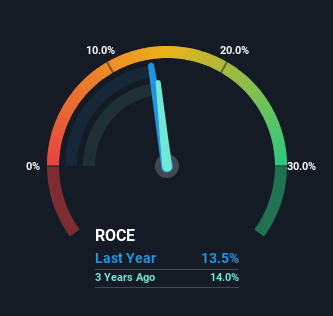
So, Frequentis has an ROCE of 13%. On its own, that's a standard return, however it's much better than the 9.9% generated by the Aerospace & Defense industry.
View our latest analysis for Frequentis
In the above chart we have measured Frequentis' prior ROCE against its prior performance, but the future is arguably more important. If you'd like, you can check out the forecasts from the analysts covering Frequentis for free.
How Are Returns Trending?
While the current returns on capital are decent, they haven't changed much. Over the past five years, ROCE has remained relatively flat at around 13% and the business has deployed 78% more capital into its operations. Since 13% is a moderate ROCE though, it's good to see a business can continue to reinvest at these decent rates of return. Stable returns in this ballpark can be unexciting, but if they can be maintained over the long run, they often provide nice rewards to shareholders.
Another thing to note, Frequentis has a high ratio of current liabilities to total assets of 42%. This can bring about some risks because the company is basically operating with a rather large reliance on its suppliers or other sorts of short-term creditors. Ideally we'd like to see this reduce as that would mean fewer obligations bearing risks.
Our Take On Frequentis' ROCE
In the end, Frequentis has proven its ability to adequately reinvest capital at good rates of return. And since the stock has risen strongly over the last three years, it appears the market might expect this trend to continue. So while the positive underlying trends may be accounted for by investors, we still think this stock is worth looking into further.
Frequentis does have some risks, we noticed 2 warning signs (and 1 which shouldn't be ignored) we think you should know about.
While Frequentis isn't earning the highest return, check out this free list of companies that are earning high returns on equity with solid balance sheets.
Have feedback on this article? Concerned about the content? Get in touch with us directly. Alternatively, email editorial-team (at) simplywallst.com.
This article by Simply Wall St is general in nature. We provide commentary based on historical data and analyst forecasts only using an unbiased methodology and our articles are not intended to be financial advice. It does not constitute a recommendation to buy or sell any stock, and does not take account of your objectives, or your financial situation. We aim to bring you long-term focused analysis driven by fundamental data. Note that our analysis may not factor in the latest price-sensitive company announcements or qualitative material. Simply Wall St has no position in any stocks mentioned.
