
 Yahoo Finance
 Is Freeport-McMoRan Inc’s (NYSE:FCX) 21.71% ROE Strong Compared To Its Industry?

The content of this article will benefit those of you who are starting to educate yourself about investing in the stock market and want a simplistic look at the return on Freeport-McMoRan Inc (NYSE:FCX) stock.
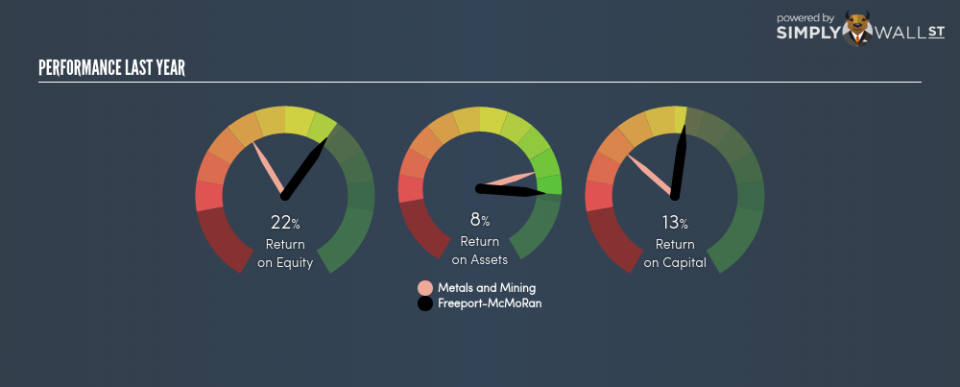
With an ROE of 21.71%, Freeport-McMoRan Inc (NYSE:FCX) outpaced its own industry which delivered a less exciting 11.07% over the past year. Superficially, this looks great since we know that FCX has generated big profits with little equity capital; however, ROE doesn’t tell us how much FCX has borrowed in debt. Today, we’ll take a closer look at some factors like financial leverage to see how sustainable FCX’s ROE is. See our latest analysis for Freeport-McMoRan
Breaking down Return on Equity
Firstly, Return on Equity, or ROE, is simply the percentage of last years’ earning against the book value of shareholders’ equity. An ROE of 21.71% implies $0.22 returned on every $1 invested. While a higher ROE is preferred in most cases, there are several other factors we should consider before drawing any conclusions.
Return on Equity = Net Profit ÷ Shareholders Equity
ROE is assessed against cost of equity, which is measured using the Capital Asset Pricing Model (CAPM) – but let’s not dive into the details of that today. For now, let’s just look at the cost of equity number for Freeport-McMoRan, which is 12.81%. Given a positive discrepancy of 8.90% between return and cost, this indicates that Freeport-McMoRan pays less for its capital than what it generates in return, which is a sign of capital efficiency. ROE can be split up into three useful ratios: net profit margin, asset turnover, and financial leverage. This is called the Dupont Formula:
Dupont Formula
ROE = profit margin × asset turnover × financial leverage
ROE = (annual net profit ÷ sales) × (sales ÷ assets) × (assets ÷ shareholders’ equity)
ROE = annual net profit ÷ shareholders’ equity
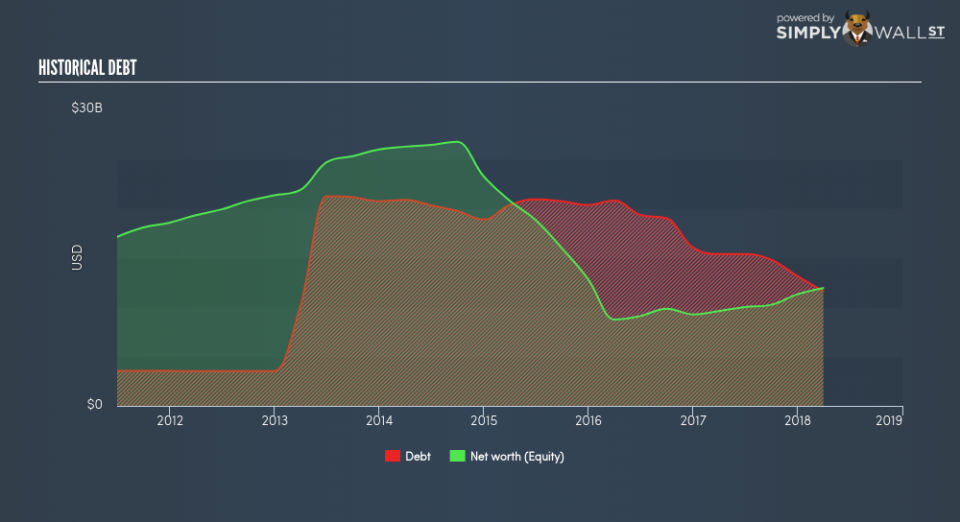
The first component is profit margin, which measures how much of sales is retained after the company pays for all its expenses. The other component, asset turnover, illustrates how much revenue Freeport-McMoRan can make from its asset base. Finally, financial leverage will be our main focus today. It shows how much of assets are funded by equity and can show how sustainable the company’s capital structure is. Since ROE can be inflated by excessive debt, we need to examine Freeport-McMoRan’s debt-to-equity level. The debt-to-equity ratio currently stands at a balanced 97.32%, meaning the above-average ROE is due to its capacity to produce profit growth without a huge debt burden.
Next Steps:
ROE is one of many ratios which meaningfully dissects financial statements, which illustrates the quality of a company. Freeport-McMoRan exhibits a strong ROE against its peers, as well as sufficient returns to cover its cost of equity. Its high ROE is not likely to be driven by high debt. Therefore, investors may have more confidence in the sustainability of this level of returns going forward. Although ROE can be a useful metric, it is only a small part of diligent research.
For Freeport-McMoRan, there are three essential aspects you should further examine:
Financial Health: Does it have a healthy balance sheet? Take a look at our free balance sheet analysis with six simple checks on key factors like leverage and risk.
Valuation: What is Freeport-McMoRan worth today? Is the stock undervalued, even when its growth outlook is factored into its intrinsic value? The intrinsic value infographic in our free research report helps visualize whether Freeport-McMoRan is currently mispriced by the market.
Other High-Growth Alternatives : Are there other high-growth stocks you could be holding instead of Freeport-McMoRan? Explore our interactive list of stocks with large growth potential to get an idea of what else is out there you may be missing!
To help readers see pass the short term volatility of the financial market, we aim to bring you a long-term focused research analysis purely driven by fundamental data. Note that our analysis does not factor in the latest price sensitive company announcements.
The author is an independent contributor and at the time of publication had no position in the stocks mentioned.
