
 Yahoo Finance
 Freedom Holding's (NASDAQ:FRHC) five-year total shareholder returns outpace the underlying earnings growth
It hasn't been the best quarter for Freedom Holding Corp. (NASDAQ:FRHC) shareholders, since the share price has fallen 19% in that time. But that doesn't undermine the fantastic longer term performance (measured over five years). In that time, the share price has soared some 627% higher! So we don't think the recent decline in the share price means its story is a sad one. But the real question is whether the business fundamentals can improve over the long term. Anyone who held for that rewarding ride would probably be keen to talk about it.
Since the long term performance has been good but there's been a recent pullback of 4.4%, let's check if the fundamentals match the share price.
See our latest analysis for Freedom Holding
To quote Buffett, 'Ships will sail around the world but the Flat Earth Society will flourish. There will continue to be wide discrepancies between price and value in the marketplace...' One flawed but reasonable way to assess how sentiment around a company has changed is to compare the earnings per share (EPS) with the share price.
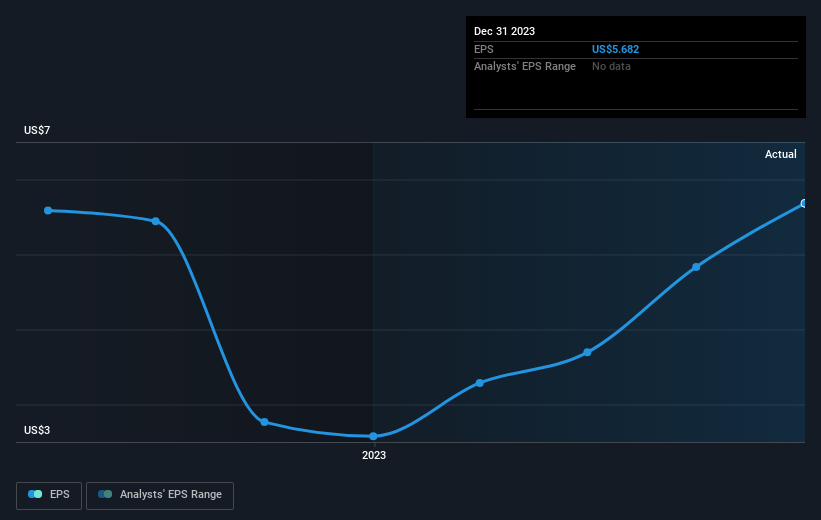
During five years of share price growth, Freedom Holding achieved compound earnings per share (EPS) growth of 258% per year. This EPS growth is higher than the 49% average annual increase in the share price. So one could conclude that the broader market has become more cautious towards the stock. This cautious sentiment is reflected in its (fairly low) P/E ratio of 11.73.
The graphic below depicts how EPS has changed over time (unveil the exact values by clicking on the image).
It's probably worth noting that the CEO is paid less than the median at similar sized companies. It's always worth keeping an eye on CEO pay, but a more important question is whether the company will grow earnings throughout the years. Dive deeper into the earnings by checking this interactive graph of Freedom Holding's earnings, revenue and cash flow.
A Different Perspective
Freedom Holding shareholders are down 9.7% for the year, but the market itself is up 23%. Even the share prices of good stocks drop sometimes, but we want to see improvements in the fundamental metrics of a business, before getting too interested. On the bright side, long term shareholders have made money, with a gain of 49% per year over half a decade. If the fundamental data continues to indicate long term sustainable growth, the current sell-off could be an opportunity worth considering. Most investors take the time to check the data on insider transactions. You can click here to see if insiders have been buying or selling.
We will like Freedom Holding better if we see some big insider buys. While we wait, check out this free list of growing companies with considerable, recent, insider buying.
Please note, the market returns quoted in this article reflect the market weighted average returns of stocks that currently trade on American exchanges.
Have feedback on this article? Concerned about the content? Get in touch with us directly. Alternatively, email editorial-team (at) simplywallst.com.
This article by Simply Wall St is general in nature. We provide commentary based on historical data and analyst forecasts only using an unbiased methodology and our articles are not intended to be financial advice. It does not constitute a recommendation to buy or sell any stock, and does not take account of your objectives, or your financial situation. We aim to bring you long-term focused analysis driven by fundamental data. Note that our analysis may not factor in the latest price-sensitive company announcements or qualitative material. Simply Wall St has no position in any stocks mentioned.
