
 Yahoo Finance
 FOREX Trading: USD/JPY Ending Year at Channel and Fibonacci Confluence
Afternoon Technicals (all charts)
FOREX Trading and Technical Analysis Observations
As we enter the final days of 2012, I’m closely monitoring…
USDJPY - The long term USDJPY inverse head and shoulders breakout the week that ended 12/14 has led to immediate gains. The traditional measuring technique yields an objective of about 9362. Currently testing upward sloping channel resistance and the 100% extension of the rally from the record low (I’m interested to see how the week closes), this would be a good time for some consolidation. 8520 is of interest as support…ESPECIALLY if on a news spike (fiscal circus anyone?).
AUDUSD – We’ve been following the AUDUSD triangle for quite some time. The massive structure, which began in July 2011, is probably a bullish triangle that eventually gives way to a thrust above 11080. However, the long awaited E wave is probably underway. Often sharp and deep in order to convince traders that the trend has changed, a drop below parity is likely before price finds bottom. 10415 is near term resistance.
USDMXN – I’ve been long since 12/17 (12.77 entry) but the upside is probably limited over the next week or so. Consolidation since the 12/24 high composes a clean triangle, probably as a 4th wave. The implications are for a thrust above 13.05 in order to complete 5 waves up from the 12/12 low. 13.16-13.19 is a target area. Longer term, price holding the 61.8% retracement of the rally from the 2011 low lends a bullish aura.
USDJPY - Weekly

Prepared by Jamie Saettele, CMT
AUDUSD - Weekly

Prepared by Jamie Saettele, CMT
USDMXN - Weekly
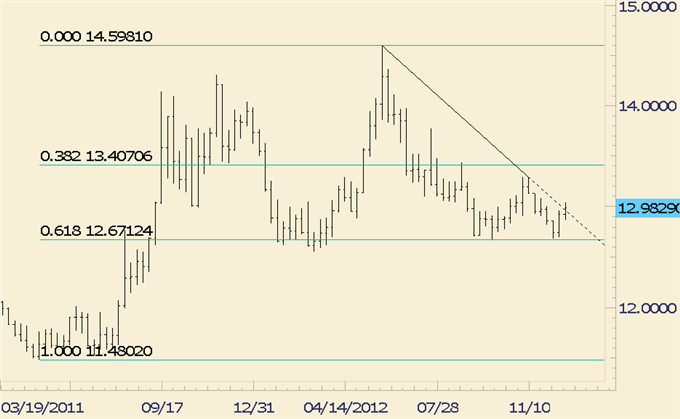
Prepared by Jamie Saettele, CMT
--- Written by Jamie Saettele, CMT, Senior Technical Strategist for DailyFX.com
To contact Jamie e-mail jsaettele@dailyfx.com. Follow me on Twitter for real time updates @JamieSaettele
Subscribe to Jamie Saettele's distribution list in order to receive actionable FX trading strategy delivered to your inbox.
Jamie is the author of Sentiment in the Forex Market.
DailyFX provides forex news and technical analysis on the trends that influence the global currency markets.
Learn forex trading with a free practice account and trading charts from FXCM.
