
 Yahoo Finance
 Forex: Like Clockwork, Yen Breaks Down - EUR/JPY Closing in on ¥124
ASIA/EUROPE FOREX NEWS WRAP
The middle of the week has arrived, which means it’s time for more Japanese Yen weakness. It’s been observed that the past several weeks have produced a clear pattern for how the Yen behaves, marked by substantial weakness headed on Wednesday and/or Thursday, after slight strength on Monday and Tuesday. On the flipside of this equation, the Euro has been an absolute monster, racking up over +100-pips overnight on little more than continued rotation out of a currency hampered by a central bank expanding its balance sheet (the Yen and the Bank of Japan) into a currency aided by a central bank signaling tightening via balance sheet shrinkage (the Euro and the European Central Bank).
In fact, as the BoJ has raised its yearly inflation target to +2% and signaled that it would monetize ¥13T/month (roughly $140-145B/month) starting in 2014, the ECB has moved in quite the opposite direction this year: since the end of December, the ECB’s balance sheet has shrunk by €89.417B, per the most recent data available on January 25 (this will be even lower at the next update on Friday in light of the LTRO repayments). The EURJPY is closing in on ¥124.00 as a result, its highest level since May 4, 2010.
With credit conditions and foreign exchange rates rapidly shifting, concerns are growing that liquidity could become a problem once more in the Euro-zone, and that economic growth could be hampered by the stronger Euro (as a result of lower competitiveness among Euro-zone exporters).The 3-month Euribor interest rate, the rate at which Euro-zone banks lend funds to one another, has risen to its highest level since September 20 as credit conditions have tightened, and as a result, ECB President Mario Draghi is expected to address these concerns in the coming weeks.
Taking a look at European credit, peripheral yields have crept up, but the impact has been negligible on the Euro. The Italian 2-year note yield has increased to 1.553% (+5.1-bps) while the Spanish 2-year note yield has increased to 2.464% (+5.4-bps). Similarly, the Italian 10-year note yield has increased to 4.227% (+6.6-bps) while the Spanish 10-year note yield has increased to 5.155% (+2.6-bps); higher yields imply yields prices.
RELATIVE PERFORMANCE (versus USD): 11:45 GMT
CHF: +0.49%
EUR: +0.42%
GBP: +0.06%
CAD:-0.16%
AUD:-0.43%
JPY:-0.59%
NZD:-0.77%
Dow Jones FXCM Dollar Index (Ticker: USDOLLAR): +0.05% (+0.57% past 5-days)
ECONOMIC CALENDAR
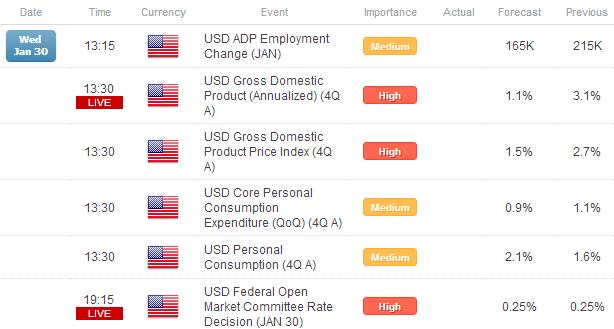
See the DailyFX Economic Calendar for a full list, timetable, and consensus forecasts for upcoming economic indicators.
TECHNICAL ANALYSIS OUTLOOK
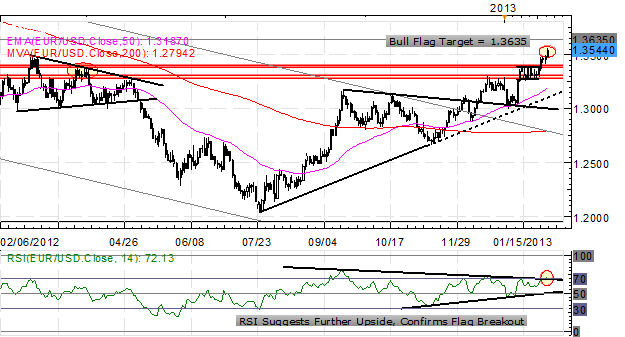
EURUSD: The Bull Flag breakout has begun after cracking 1.3485, “with a final measured move pointing towards 1.3635.” Support comes in at 1.3470/3500, 1.3380/85 (mid-March swing high, Bull Flag resistance), and 1.3280/3310. Resistance is 1.3545/50 (price is here now), and 1.3635.
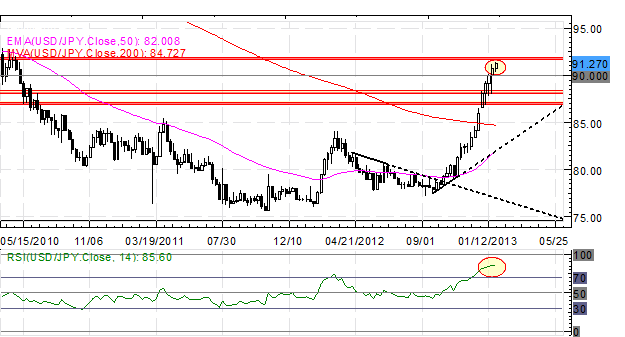
USDJPY: The USDJPY rally is back on the up and up, with price breaking above 91.00 (perhaps a Bull Flag on the hourly chart had developed, hindsight being 20/20). I maintain: “The focus remains on buying dips, and generally speaking, selling Yen strength (EURJPY, USDJPY preferred for gains; CADJPY, GBPJPY preferred for loses).” Resistance comes in at 92.00/05 (weekly R1), 93.15/20 (weekly R2), and 93.45/50 (monthly R3). Support comes in at 91.00 and 90.00/10 (weekly pivot, monthly R2).
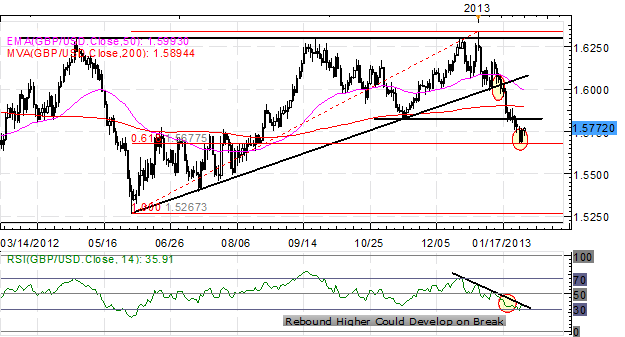
GBPUSD: The pair has rallied off of the 61.8% Fibonacci retracement from the June low to January high, but I maintain: as long as the daily RSI downtrend holds, it is possible for a move lower.” This may break today, signaling an end to the bearish bias for the near-term, and wouldn’t rule out a rally back towards the 50-EMA and significant psychological resistance at 1.5990/6000. Support is 1.5700 and 1.5675/80.
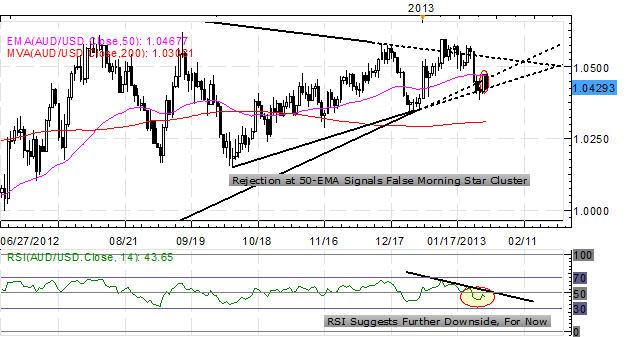
AUDUSD:No change: “The pair continues to range although it has showed signs of cracking, with both the ascending trendline off of the June low and the October low having been breached, as well as the ascending TL off of the June low and the December low. Accordingly, a weekly close below 1.0460 could signal a deeper retracement towards 1.0350/400, before a greater breakdown towards parity. Support comes in at 1.03800/400 (weekly low), 1.0340/50 (December low), and 1.0140/50 (October low). Resistance is 1.0460/70 (ascending TL off of the June and December lows, 50-EMA) and 1.0500/15.” Note: the Morning Star candlestick cluster isn’t seeing any follow through today, as the daily RSI downtrend has persisted.
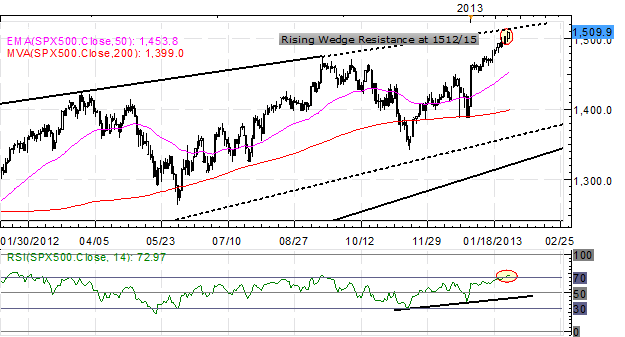
S&P 500: Yesterday I said: “as indicated on the charts the past weeks, noting “nearing the top 1505/1512” – the top was 1504.6. If this breaks, 1520 is in sight.” Indeed, the irrational exuberance has continued, bringing topline Bearish Rising Wedge resistance in focus at 1512/15; the December 2007 highs of 1520/24 could be reached on an overshoot. Bottom line: I’m expecting a crash in the S&P 500 unless volumes accelerate rapidly, given the disconnect from reality.
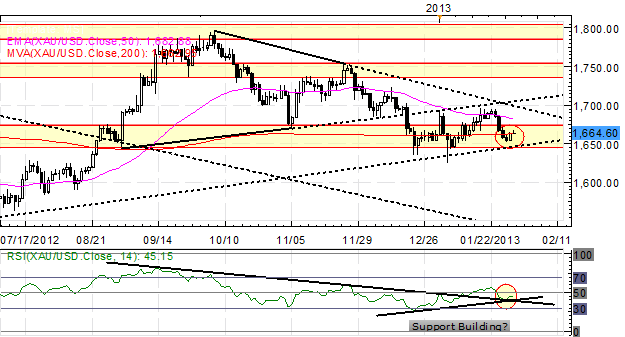
GOLD: The past few weeks I’ve maintained: "When considering the move off of the September highs, a measured A-B=C-D (as expressed on the Daily) suggests that a bottom could be in place at [1630/40].” The rebound has ensued, with the alternative safe haven rallying up to 1690 today. A daily close above 1700 points towards 1722/25 and 1755. Support is 1663 (200-EMA) and 1640/45.
--- Written by Christopher Vecchio, Currency Analyst
To contact Christopher Vecchio, e-mail cvecchio@dailyfx.com
Follow him on Twitter at @CVecchioFX
To be added to Christopher’s e-mail distribution list, please fill out this form
DailyFX provides forex news and technical analysis on the trends that influence the global currency markets.
Learn forex trading with a free practice account and trading charts from FXCM.
