
 Yahoo Finance
 Forex Analysis: US Dollar, S&P 500 Meet Trend-Setting Technical Barriers
THE TAKEAWAY: The US Dollar and the S&P 500 stand at key barriers defining the risk-off trend prevalent since mid-September, threatening a reversal ahead.
US DOLLAR TECHNICAL ANALYSIS– Prices broke below the 23.6% Fibonacci retracement at 9993 to challenge the bottom of a rising channel set from mid-September (now at 9966). A break below this boundary initially exposes the 38.2% level at 9945. Alternatively, a break back above 9993 aims for the November 16 high at 10071.
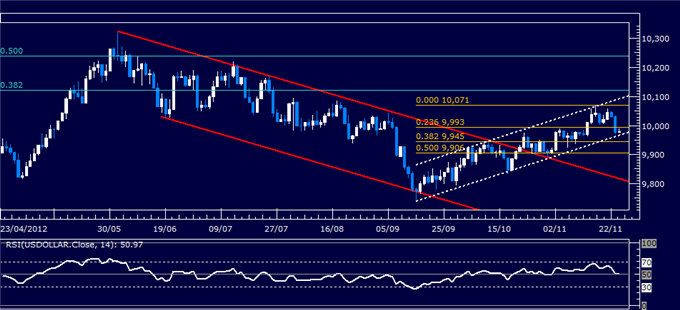
Daily Chart - Created Using FXCM Marketscope 2.0
S&P 500 TECHNICAL ANALYSIS – Prices rebounded as expected after completing Bullish Engulfing candlestick pattern. The bulls have now overcome the 38.2% Fibonacci retracement at 1392.80 to test the 50% level at 1408.50, a barrier reinforced by a falling trend line set from mid-October. A break above this initially targets the 1424.90-30.90 area. The 1392.80 level has been recast as near-term support, with a dropbelow that aiming to challenge the 23.6% retracement at 1373.40.
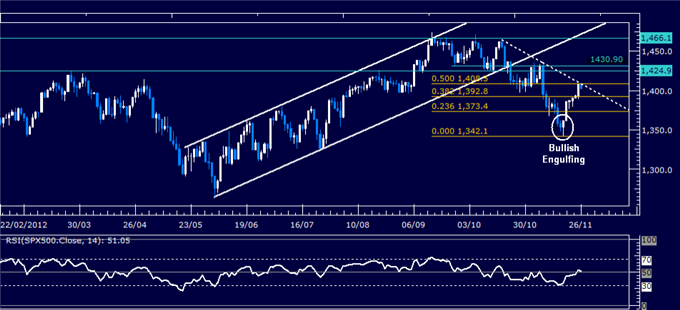
Daily Chart - Created Using FXCM Marketscope 2.0
GOLD TECHNICAL ANALYSIS – Prices appear to have carved out a bullish Inverse Head and Shoulders chart pattern confirmed with a close above neckline resistance at 1737.28, 23.6% Fibonacci retracement. The setup implies a measured upside target at 1802.06. The 1737.28 level has been recast as near-term support, with a break below that aiming for the 38.2% Fib at 1688.65.
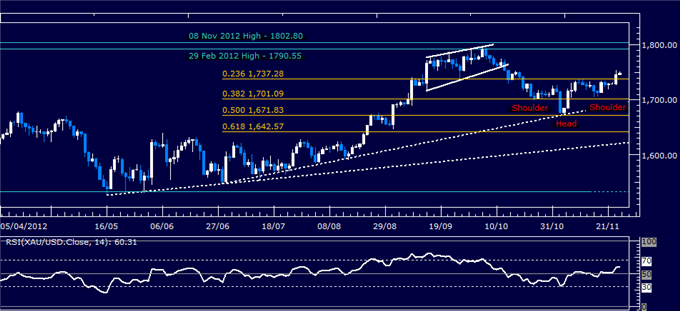
Daily Chart - Created Using FXCM Marketscope 2.0
Want to learn more about RSI? Watch this Video.
CRUDE OIL TECHNICAL ANALYSIS– Prices are consolidating below resistance at 89.48, the 23.6% Fibonacci expansion, after taking out falling trend line set from the September 14 high (now at 84.95). A drop below that exposes the November 7 low at 84.04. Alternatively, a push above resistance targets the 38.2% level at 92.88.
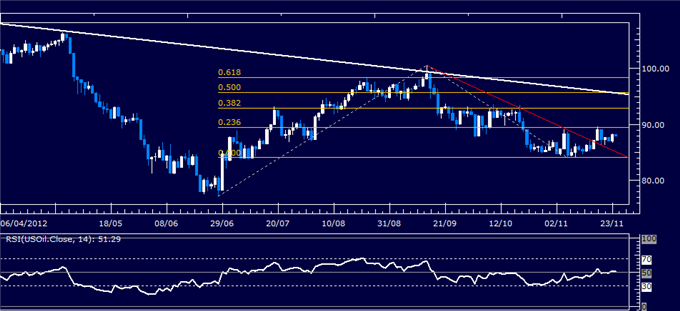
Daily Chart - Created Using FXCM Marketscope 2.0
--- Written by Ilya Spivak, Currency Strategist for Dailyfx.com
To contact Ilya, e-mail ispivak@dailyfx.com. Follow Ilya on Twitter at @IlyaSpivak
To be added to Ilya's e-mail distribution list, please CLICK HERE
DailyFX provides forex news and technical analysis on the trends that influence the global currency markets.
Learn forex trading with a free practice account and trading charts from FXCM.
