
 Yahoo Finance
 Forex Analysis: US Dollar Finds Support as S&P 500 Continues to Stall
THE TAKEAWAY: The US Dollar appears to have found interim support after a correction lower while the S&P 500 continues to tread water below familiar chart resistance.
US DOLLAR TECHNICAL ANALYSIS– Prices found support at 10059, the 23.6% Fibonacci retracement. A bounce from here sees initial channel top resistance at 10133, with a break above that targeting the January 4 high at 10158. Alternatively, a drop through support exposes the 38.2% level at 9998.

Daily Chart - Created Using FXCM Marketscope 2.0
S&P 500 TECHNICAL ANALYSIS – Prices launched sharply higher in the aftermath of a deal to avert the fiscal cliff, taking out a falling trend line set from mid-September and exposing resistance at 1466.10. A break above that targets the 1471.60-1474.90 area marked by the October 5 and September 14 swing highs. Initial support is at 1450.10, the December 19 top, with a break below that eyeing the trend line at 1439.60 and a horizontal pivot at 1432.90.
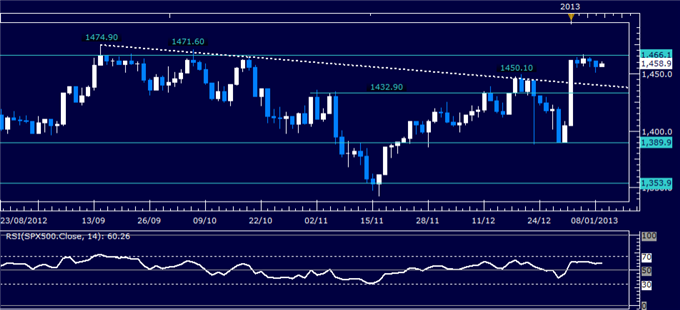
Daily Chart - Created Using FXCM Marketscope 2.0
GOLD TECHNICAL ANALYSIS – Prices found support at the bottom of a falling channel set from mid-September 2012, recovering to the 23.6% Fibonacci retracement at 1665.66. A break above that exposes the 38.2% level at 1690.39. The first layer of major support is at 1620.84, the channel bottom.
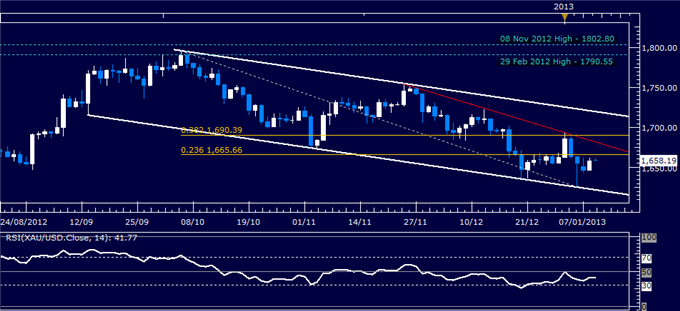
Daily Chart - Created Using FXCM Marketscope 2.0
Want to learn more about RSI? Watch this Video.
CRUDE OIL TECHNICAL ANALYSIS– Prices put in a Hanging Man candlestick below resistance at 93.25, the 100% Fibonacci expansion, hinting a move lower is ahead. Near-term support is in the 91.23-92.01 area, marked by the 61.8% and 76.4% Fibs respectively. This barrier is reinforced by the formerly broken top of a rising channel top set from early November.A drop below 91.23 exposes the 90.00 figure. Alternatively, a reversal above 93.25 aims for the 123.6% expansion at 94.51.
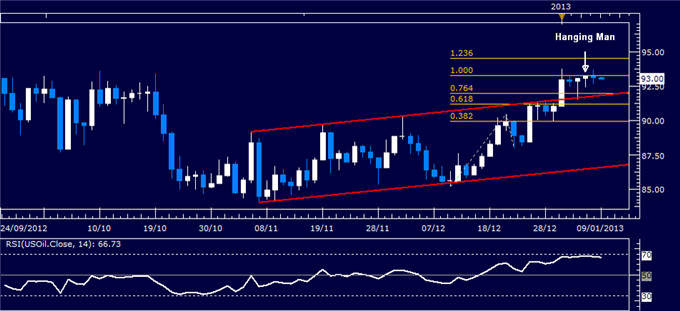
Daily Chart - Created Using FXCM Marketscope 2.0
--- Written by Ilya Spivak, Currency Strategist for Dailyfx.com
To contact Ilya, e-mail ispivak@dailyfx.com. Follow Ilya on Twitter at @IlyaSpivak
To be added to Ilya's e-mail distribution list, please CLICK HERE
DailyFX provides forex news and technical analysis on the trends that influence the global currency markets.
Learn forex trading with a free practice account and trading charts from FXCM.
