
 Yahoo Finance
 Forex Analysis: US Dollar Chart Setup Warns of a Turn Lower
THE TAKEAWAY: US Dollar technical positioning warns the currency may be readying to reverse lower after hitting the highest level in six months.
US DOLLAR TECHNICAL ANALYSIS– Prices are put in a Shooting Star candlestick below resistance marked by the 61.8% Fibonacci expansion (10181) and a rising channel top (10191), hinting a move lower is ahead. Initial support is at 10153, the 50% level, with a break below that targeting the 38.2% Fib at 10124. Alternatively, a push above resistance aims for the 76.4% expansion at 10216.
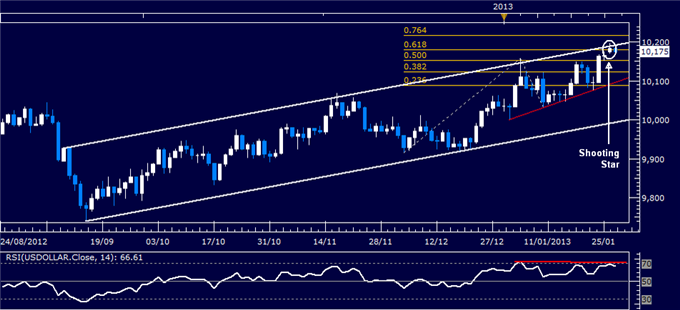
Daily Chart - Created Using FXCM Marketscope 2.0
S&P 500 TECHNICAL ANALYSIS – Prices are testing resistance at 1503.50, the 76.4% Fibonacci retracement, with a break higher targeting the 100% level at 1553.00. Near-term support is in the 1472.50-74.90 region, marked by the 61.8% Fib and the September 14 high.
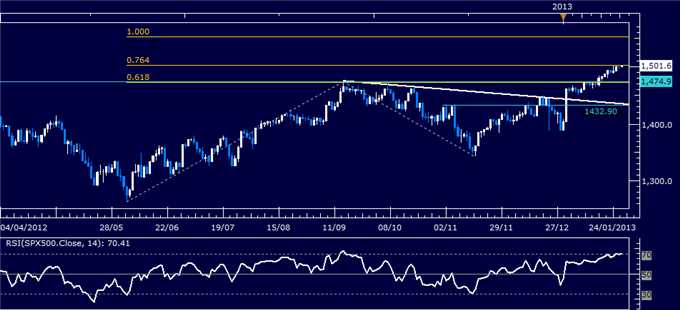
Daily Chart - Created Using FXCM Marketscope 2.0
GOLD TECHNICAL ANALYSIS – Prices are testing major rising trend line support dating back to mid-May (1652.69). A break below that aims for the January 4 low at 1625.69 and a falling channel bottom at 1605.29. Near-term resistance is at 1690.39, the 38.2% Fibonacci retracement.
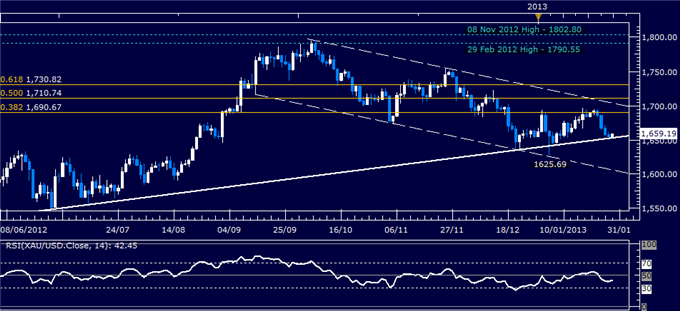
Daily Chart - Created Using FXCM Marketscope 2.0
Want to learn more about RSI? Watch this Video.
CRUDE OIL TECHNICAL ANALYSIS– Prices have completed a Bearish Engulfing candlestick pattern, hinting a move lower may be ahead. Near-term rising trend line support is at 95.96. A break below that exposes 94.61. Resistance is at 97.41, with a push above this barrier aiming for 98.99.
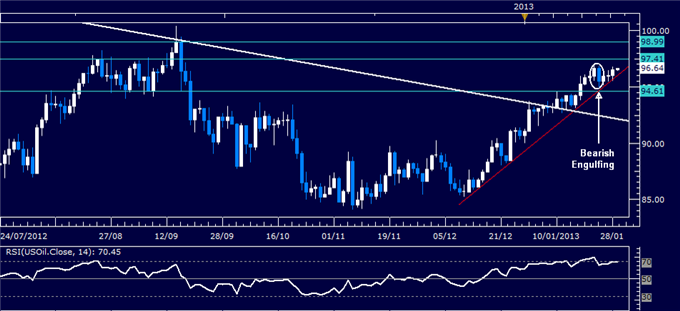
Daily Chart - Created Using FXCM Marketscope 2.0
--- Written by Ilya Spivak, Currency Strategist for Dailyfx.com
To contact Ilya, e-mail ispivak@dailyfx.com. Follow Ilya on Twitter at @IlyaSpivak
To be added to Ilya's e-mail distribution list, please CLICK HERE
DailyFX provides forex news and technical analysis on the trends that influence the global currency markets.
Learn forex trading with a free practice account and trading charts from FXCM.
