
 Yahoo Finance
 Forex Analysis: S&P 500 Chart Setup Contradics US Dollar Selloff
THE TAKEAWAY: S&P 500 technical positioning warns of a reversal lower, hinting the recent selloff in the US Dollar may not last amid returning haven demand for the greenback.
US DOLLAR TECHNICAL ANALYSIS– Prices broke through support at the bottom of a rising channel set from mid-September and the 38.2% Fibonacci retracement at 9945. Sellers now aim to target the 50% level at 9906. A push below that exposes the 61.8% Fib at 9866. The 9945 level has been recast as near-term resistance, with a break back above that eyeing the channel bottom now at 9973.
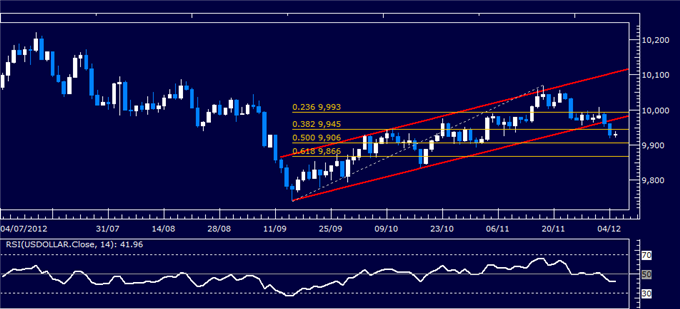
Daily Chart - Created Using FXCM Marketscope 2.0
S&P 500 TECHNICAL ANALYSIS – Prices put in a bearish Evening Star candlestick pattern below resistance in the 1424.90-1430.90 area, hinting the upward correction witnessed since mid-September may be over and the dominant down trend ready to resume. Initial support lines up at 1394.30, the 23.6% Fibonacci expansion. A break below that targets the 38.2% level at 1374.90. Alternatively, a push above 1430.90 exposes the familiar triple top at 1466.10.
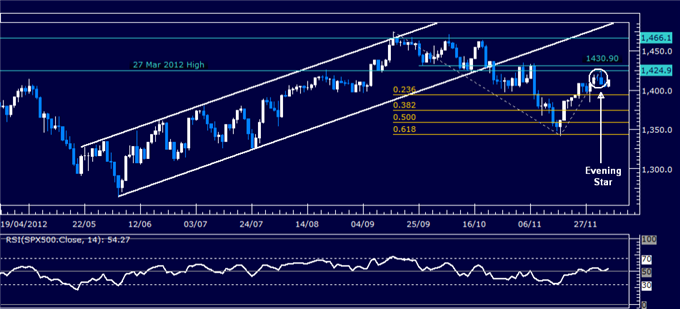
Daily Chart - Created Using FXCM Marketscope 2.0
GOLD TECHNICAL ANALYSIS – Prices broke lower as expected after putting in a Bearish Engulfing candlestick pattern, taking out support at a rising trend line set from late June. Sellers now aim to challenge the November 5 low at 1672.50. The trend line (now at 1703.56) has been recast as resistance, with a push back above that aiming to challenge 1752.55.
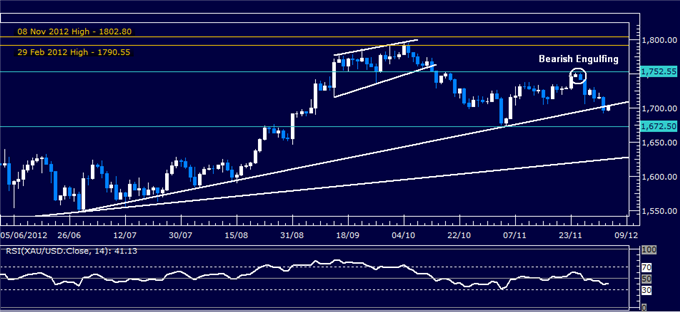
Daily Chart - Created Using FXCM Marketscope 2.0
Want to learn more about RSI? Watch this Video.
CRUDE OIL TECHNICAL ANALYSIS– Prices put in a Shooting Star candlestick below resistance at the 23.6% Fibonacci expansion (89.48), a barrier reinforced by a minor rising channel top at 90.60, hinting a move lower is ahead. Near-term support is at 87.42, the 14.6% Fib, with a break below that exposing the channel bottom at 85.61 as well as the November 7 low at 84.04. Alternatively a break above 90.60 exposes the 38.2% expansion at 92.87.
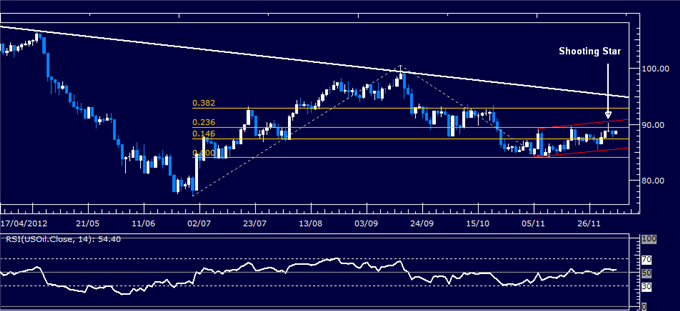
Daily Chart - Created Using FXCM Marketscope 2.0
--- Written by Ilya Spivak, Currency Strategist for Dailyfx.com
To contact Ilya, e-mail ispivak@dailyfx.com. Follow Ilya on Twitter at @IlyaSpivak
To be added to Ilya's e-mail distribution list, please CLICK HERE
DailyFX provides forex news and technical analysis on the trends that influence the global currency markets.
Learn forex trading with a free practice account and trading charts from FXCM.
