
 Yahoo Finance
 Forex Analysis: Euro Completes Year Long Bullish Base
The EURUSD closed the week above both long term and short term trendlines, completing a yearlong bullish reversal pattern in the process. 13040/65 is estimated support for those looking to position for a more pronounced bull run to end the year.
EURUSD
Weekly

Prepared by Jamie Saettele, CMT
FOREX Observation: The EURUSD closed at its highest level since April following a strong European close. Price closed above the trendline that extends off of the April 2011 and August 2011 highs as well as shorter term trendlines off of the February and September highs (one could call that the inverse head and shoulders neckline) and September and October highs. These shorter term lines may come into play as support in the coming weeks.
FOREX Trading Implication: Given the powerful implications from the inverse head and shoulders pattern that began on January 2013, risk is immense for shorts. The 61.8% of the decline from the 2011 high is 13832 and the traditional head and shoulders measuring technique yields about 14460. In other words, upside potential into late December / early January is significant. To position for possible run, I’d like to see a test of the just broken short term trendlines as support. Those lines come in at about 13035/65 next week.
EURUSD
60 Minute
Prepared by Jamie Saettele, CMT
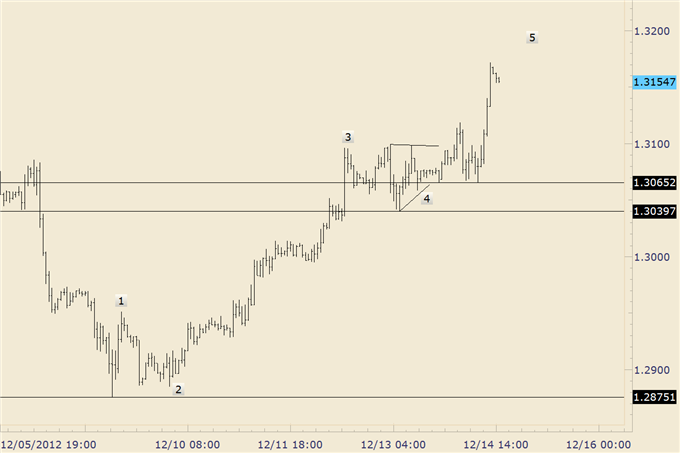
FOREX Observation: The rally from 12875 is impulsive with the latest surge today possibly composing most of a terminal thrust in the 5th wave position. A setback (probably from slightly higher levels) should find support at the former 4th wave, which is 13065 (pattern ending) and 13040 (pattern price low). Interestingly, these are the exact same levels that the broken trendlines cross next week.
FOREX Trading Implication: Looking to buy weakness into 13040/65.
US Dollar / Japanese Yen
Weekly
Prepared by Jamie Saettele, CMT
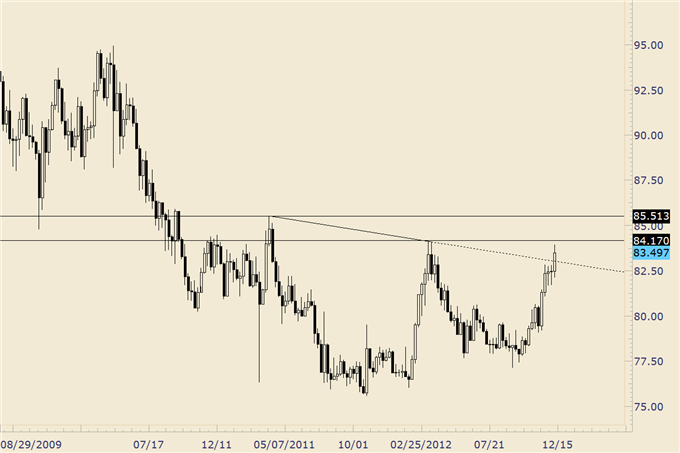
FOREX Observation: Like the EURUSD, the USDJPY closed the week above the line that extends off of the April 2011 and March 2012 highs. One can certainly term the line a neckline from a 2 year head and shoulders pattern.
FOREX Trading Implication: The implications from the pattern should not be taken lightly. The traditional head and shoulders measuring technique yields a target of 9383, which is just below the May 2010 (prior to the flash crash) high of 9498.
US Dollar / Japanese Yen
Daily
Prepared by Jamie Saettele, CMT
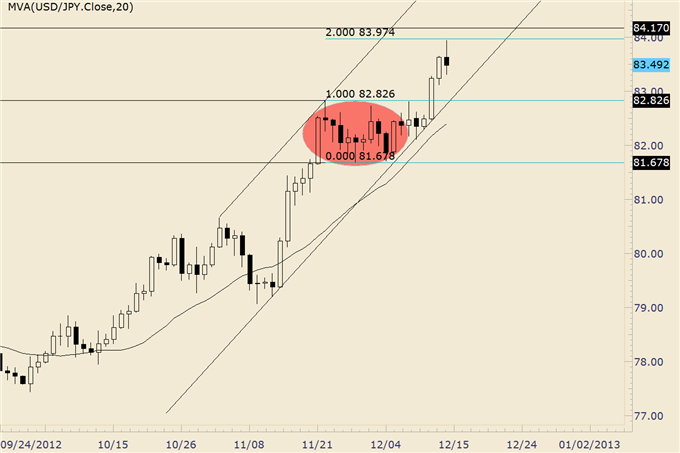
FOREX Observation: The long term implications are quite bullish but a corrective drop is probably underway. A JS Spike was registered today, indicating an emotional top. These tend to last for at least a week. From a pattern perspective, the latest advance is from a sideways pattern that is probably a triangle. Triangles often precede the final leg of a larger move. A measured objective is derived by adding the width of the consolidation (triangle) to the breakout level. 8283 + (8283-8168) = 8398. The estimated top isn’t even 1 pip from the high.
FOREX Trading Implication: The implications are for a pullback into the triangle. Given opening range implications for the month, it’s unlikely that the USDJPY will return to 8168 so I’ll be watching for support closer to the top of the triangle and from the 20 day average.
New Zealand Dollar / US Dollar
Daily
Prepared by Jamie Saettele, CMT
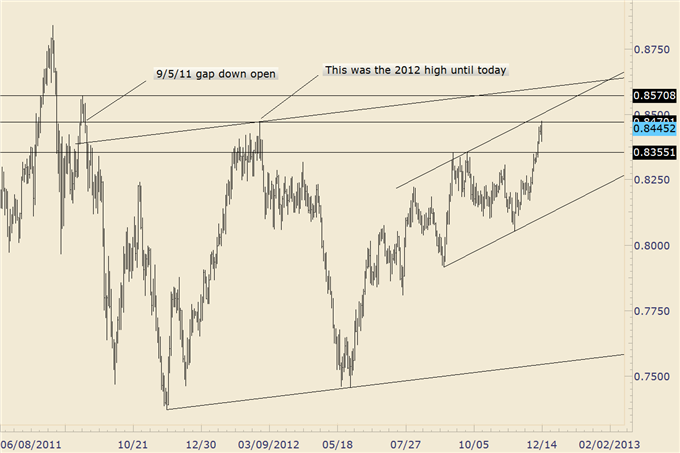
FOREX Observation: The NZDUSD traded to 2012 high today, barely poking above the 2/29/12 high of 8470. This level is of significant for another reason; it was the close on 9/2/11 which preceded the gap down open on 9/5/11. The 9/2 close at 8477 is actually still ‘unclosed’ as today’s high was 1 pip shy. Focus throughout the month remains higher towards channel resistance levels and the August 2011 high at 8470 in particular (the rally from the 2011 low would consist of 2 equal legs at 8558 too). Near term, if there were a time and place for at least some consolidation, it would be now. Support extends down to 8320.
FOREX Trading Implication: Expecting mean reversion into 8320 before the next leg higher.
--- Written by Jamie Saettele, CMT, Senior Technical Strategist for DailyFX.com
To contact Jamie e-mail jsaettele@dailyfx.com. Follow him on Twitter @JamieSaettele
Subscribe to Jamie Saettele's distribution list in order to receive actionable FX trading strategy delivered to your inbox.
Jamie is the author of Sentiment in the Forex Market.
DailyFX provides forex news and technical analysis on the trends that influence the global currency markets.
Learn forex trading with a free practice account and trading charts from FXCM.
