
 Yahoo Finance
 Forex Analysis: EUR/CHF Trades to 20 Month High; Significant Breakout?
Longer term focus remains on the Euro crosses, which may be on the verge of significant bullish breakouts. Yen trading volume is consistent with at least near term capitulation.
Japanese Yen Futures Contract with Volume
Weekly

Prepared by Jamie Saettele, CMT
FOREX Observation: I am showing the futures chart rather than spot in order to show volume. Thursday’s volume was the highest since October 31st 2011, which was the coordinated intervention day. On a weekly basis, volume reached its highest level since the week that ended March 18th, 2011. That was also an intervention week and just after the devastating earthquake. The situations are different in that the 2011 volume events can be explained by exogenous factors but the situations are similar in that volume of this magnitude is consistent with capitulation. The close of a high volume week (or day) is important because a lot of volume occurs at the close or near the close. For this reason it’s interesting that the USDJPY is nearing the May 2010 flash crash close level of 9059. (The magenta bars indicate the highest volume in at least 13 weeks).
FOREX Trading Implication: 9050/70 is an area that could produce a top. The longer term trend is higher (towards a weaker Yen) but there will be sharp corrections along the way.
EURUSD
Weekly

Prepared by Jamie Saettele, CMT
FOREX Observation: “A yearlong bottoming pattern has been confirmed as complete and the first EURUSD objective isn’t until above 13800 (61.8% of decline from 2011 high and where the rally from the 2012 low would consist of 2 equal legs).”
FOREX Trading Implication: Given the significance of the longer term bottoming pattern, I’m willing to stay bullish as long as price is above 13100. I’m a buyer on dips with interest at 13250 (see daily chart below…the 20 day average and trendline that has served as support and resistance since November is near that level along with last Friday’s low and this week’s low).
EURUSD
Daily

Prepared by Jamie Saettele, CMT
GBPUSD
Weekly

Prepared by Jamie Saettele, CMT
FOREX Observation: The GBPUSD accelerated lower today following the nearly 7 month trendline break. Near term focus is on the November low at 15822, which is also the 50% retracement of the rally from the June low. The nearly 4 year triangle line comes in just above 15700 next week.
FOREX Trading Implication: Given the potential for an even more significant breakdown in the coming weeks, continue to move the stop down. Since yesterday, the stop has been moved down from 16185 (initial risk) to 16105 (breakeven) to 15955.
Euro / Australian Dollar
Daily

Prepared by Jamie Saettele, CMT
FOREX Observation: The EURAUD is again threatening the neckline from the inverse head and shoulders pattern that begin in February 2012. If this break materializes then long term objectives don’t begin until the March 2011 high at 14343 (see the monthly chart below for perspective). Bulls must contend with the 2012 high at 13030 before then of course. Near term conditions must be described as range until price overcomes the 1/2 high at 12726.
FOREX Trading Implication: Looking to buy a dip into 12520/70 or buy a breakout above 12806.
Euro / Swiss Franc
Weekly
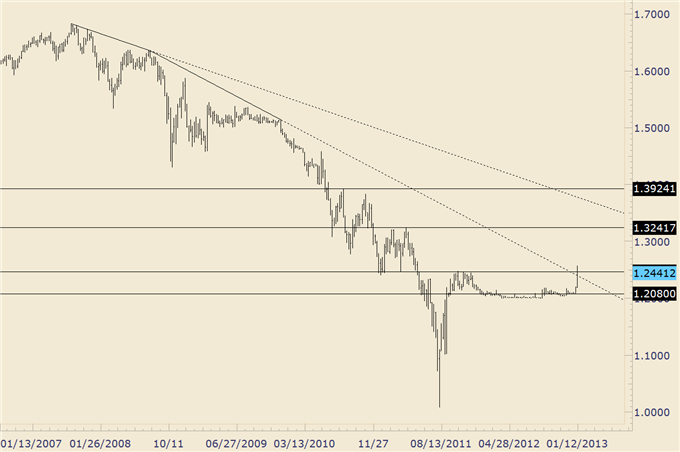
Prepared by Jamie Saettele, CMT
FOREX Observation: The EURCHF is a market again and may be gearing for a run to counter at least a significant portion of the decline from the 2007 high. Price traded through the October 2011 high and a multiyear trendline this week before settling just below the upper quartile of the week’s range. Support extends from the current level to 12300 and the next significant resistance level isn’t until above 13200. Trader sentiment surrounding this market is fascinating. Many were willing to sit in a position that did nothing for an entire year and many are willing to exit the position after 2 weeks of strength.
FOREX Trading Implication: I’ll maintain a bullish bias as long as price is above the former range high of 12184.
Australian Dollar / New Zealand Dollar
Weekly
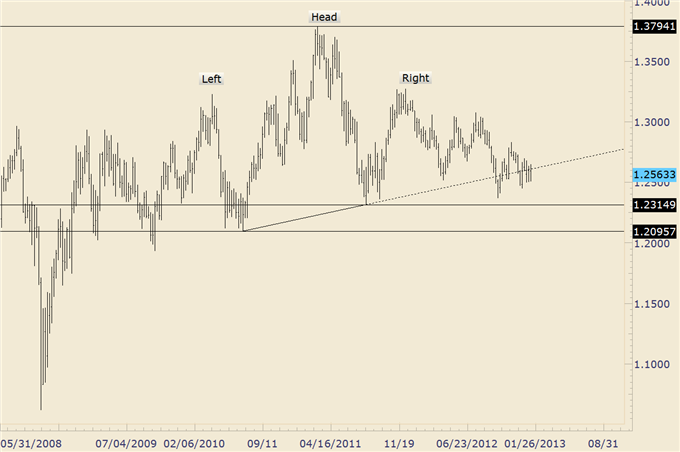
Prepared by Jamie Saettele, CMT
FOREX Observation: If 2013 is ‘the year of the breakout’, then the next big AUDNZD move is probably lower…a lot lower. A multiyear head and shoulders top is complete in the AUDNZD. After a false break in December, price is once again below the neckline. Weakness below October’s low (12370) is needed to get comfortably bearish. Until then, this is a range.
FOREX Trading Implication: Weakness below October’s low (12370) is needed to get comfortably bearish. Until then, this is a range.
--- Written by Jamie Saettele, CMT, Senior Technical Strategist for DailyFX.com
To contact Jamie e-mail jsaettele@dailyfx.com. Follow him on Twitter @JamieSaettele
Subscribe to Jamie Saettele's distribution list in order to receive actionable FX trading strategy delivered to your inbox.
Jamie is the author of Sentiment in the Forex Market.
DailyFX provides forex news and technical analysis on the trends that influence the global currency markets.
Learn forex trading with a free practice account and trading charts from FXCM.
