
 Yahoo Finance
 Forex Analysis: Dollar Shows Signs of Pullback at Key Resistance Level
THE TAKEAWAY: The US Dollar has stalled at key chart resistance, with candlestick positioning now showing early signs of a possible turn lower in the days ahead.
US DOLLAR TECHNICAL ANALYSIS– Prices put in a Shooting Star candlestick below resistance at 10044, the 32.8%Fibonacci expansion, hinting a move lower may be ahead. Resistance is reinforced rising trend line support-turned-resistance set from the September 14 low (10055). Initial support marked by the 23.6% expansion at 9995. Alternatively, a reversal above resistance targets the 50% level at 10082.

Daily Chart - Created Using FXCM Marketscope 2.0
S&P 500 TECHNICAL ANALYSIS – Prices broke down as expected after putting in a bearish Dark Cloud Cover candlestick pattern below falling trend line resistance set from the September 14 high. Sellers have now overcome the 50%Fibonacci retracementat 1396.10, exposing the 61.8% level at 1383.40. A break below that aims for the 76.4% Fib at 1367.60. The 1396.10 has been recast as near-term resistance, with a reversal back above that targeting the 38.2% retracement at 1408.80.

Daily Chart - Created Using FXCM Marketscope 2.0
GOLD TECHNICAL ANALYSIS – Prices are consolidating between the 14.6% and 23.6% Fibonacci retracements at 1652.77 and 1663.46, respectively. A break higher initially exposes the 38.2% level at 1680.80. Alternatively, a drop below support targets the December 21 low at 1635.43.

Daily Chart - Created Using FXCM Marketscope 2.0
Want to learn more about RSI? Watch this Video.
CRUDE OIL TECHNICAL ANALYSIS– Prices turned lower as expected after putting in a Doji candlestick below resistance marked by the 61.8% Fibonacci expansion (91.23) and the top of a rising channel set from early November (now at 91.47). Sellers are now testing initial support is at 90.60, the 50% Fib, with a drop below that exposing the 38.2% expansion at 89.97. Alternatively, a turn above the channel top targets the 76.4% level squarely at the 92.00 figure.
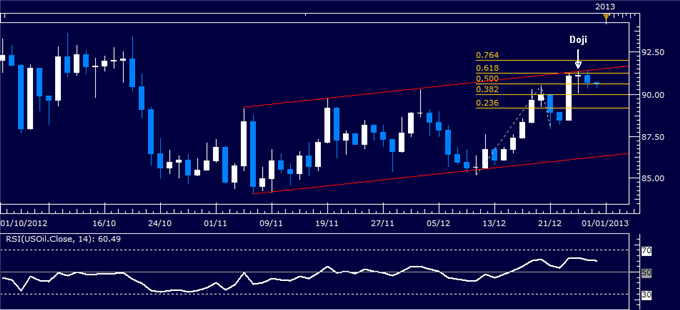
Daily Chart - Created Using FXCM Marketscope 2.0
--- Written by Ilya Spivak, Currency Strategist for Dailyfx.com
To contact Ilya, e-mail ispivak@dailyfx.com. Follow Ilya on Twitter at @IlyaSpivak
To be added to Ilya's e-mail distribution list, please CLICK HERE
DailyFX provides forex news and technical analysis on the trends that influence the global currency markets.
Learn forex trading with a free practice account and trading charts from FXCM.
